
Overview
In this assignment, you’ll explore how to change the surface of a structure to respond to data from various input sources, including:
- data files and image files
- physical properties of the surface elements, such as location, elevation, or orientation


Steps to Complete
Stage 1 - Rise and Shine (for 2 or more units)
For Stage 1, you’ll work with data that is sampled from an image file to adjust the color or height of wall panels.
Part 1 - Use Image Data to Adjust the Color of Surface Panels
- Here are some examples of colorizing a grid of wall panels to create artistic effects.


- A here’s a much larger-scale example - the MSG Sphere in Las Vegas. It uses a hexagonal grid over a spherical surface.


- Provide sliders that will allow users to quickly change:
- the arc’s radius
- the arc’s starting angle
- the arc’s ending angle
- the height of the wall
- Draw an arc curve on the base plane.
- Select this arc curve and extrude it in the Z direction to the specified height.
- Use the Lunchbox Panel.PanelQuad node to divide the surface into rectangular panels.
- Set the u and v inputs to create a grid of nearly square panels - similar to the pixels on an LED screen.
- Create formulas to smartly determine the u and v inputs based on the length of the arc curve and the height of the wall. The number of panels should update as the wall dimensions change, and the panels should maintain a nearly square shape.
- If using Dynamo, use the panel points and very simple adaptive panel (for example, Rect Seamless Panel-4pt) - to create the wall panels in Revit.
- Copy an image file into the same folder as your main graph.
- Read this image file.
- Sample the image data to determine the colors that will be applied to the panels on your wall.
- Map the list of color values to the adaptive panels using the workflow shown in the examples.
- Flex your input sliders to come up with a unique length and height for your wall and confirm that your code works for the new dimensions.
- Save a screenshot showing your model geometry with the image colors mapped to the wall panels.
- Save your files for this part of the assignment using a file name that ends with “_Stage1_Part1”
Part 2 - Use Image Data to Adjust the Height of Surface Panels
Here are some examples of adjusting the height of surface panels to create artistic effects.


- Provide sliders that will allow users to quickly change:
- the length of the wall
- the height of the wall
- the number of waves in the wall
- the amplitude of the waves in the wall
- Draw a line of the desired length on the base plane.
- Use a variation of the Sine or Cosine node to transform this line into a wavy curve on the base plane.
- Select this wavy curve and extrude it in the Z direction to the specified height.
- Use the Lunchbox Panel.PanelQuad node to divide the surface into rectangular panels.
- Set the u and v inputs to create a grid of rectangular panels - about 4” tall x 8” wide - similar to bricks in a wall arranged in a stacked pattern.
- Create formulas to smartly determine the u and v inputs based on the length of the base curve and the height of the wall. The number of “bricks” should update as the wall dimensions change, and the “bricks” should maintain their 4” x 8” shape.
- If using Dynamo, use the panel points and a very simple adaptive panel (for example, Rect Seamless Panel-4pt) - to create the “bricks” in Revit.
- Copy another image file (different from the one you used for Part 1) into the same folder as your main graph.
- Read this image file.
- Sample the image data to determine the height values that will determine the thickness of the “bricks” in your wall.
- Map the list of color values to set the “Height” of each of the adaptive panels using the workflow shown in the examples.
- If using Dynamo, use the Color.Brightness node to transform the brightness of each sampled color into data value (ranging from 0 to 1).
- Remap the brightness values from the sample image into a range of heights from 4” to 36”.
- Flex your input sliders to come up with a unique length, height, and waviness for your wall and confirm that your code works for the new dimensions.
- Save a screenshot showing your model geometry with the brightness values of the sampled image mapped to the thickness of the wall panels.
- Save your files for this part of the assignment using a file name that ends with “_Stage1_Part2”
Stage 2 - Gonna Need Shades (for 3 or more units)
For Stage 2, you’ll create a model of a simple building form and panelize the wall surfaces. Then evaluate the orientation of the wall panels (relative to the sun position) and use this data to adjust parameters of the wall panels.
- Use the Rectangle.ByWidthLength node to create a rectangle that is centered on the origin.
- Provide sliders that will allow users to quickly change:
- the building length at the lower level
- the building depth at the lower level
- the height of the lower level walls
- Use the Surface.ByPatch and Surface.PerimeterCurves to break the rectangle sides into separate curves.
- Extrude these four curves to the height of the lower level walls.
- Provide sliders that will allow users to quickly change:
- the offset distance of the upper level walls relative to the lower level.
- the height of the upper level walls
- Extrude the four curves of this upper level rectangle to the height of the upper level walls.
- Use the Lunchbox Panel.PanelQuad node to divide the wall surfaces into rectangular panels.
- Set the u and v inputs to create a pattern of tall rectangular panels - similar to the glazing panes of a curtain wall.
- For simplicity, specify that your panelized walls surfaces will be 1 panel tall.
- Create a formula based on the length of each wall segment to determine the number of panels in the horizontal direction for that segment.
- Provide a slider to set the desired panel width.
- Divide the wall segment length by the desired panel width to compute the number of whole panels that could fit into this length.
- Use a Ceiling node to round this number up to the next whole integer.
- Use this number to specify the number of panels.
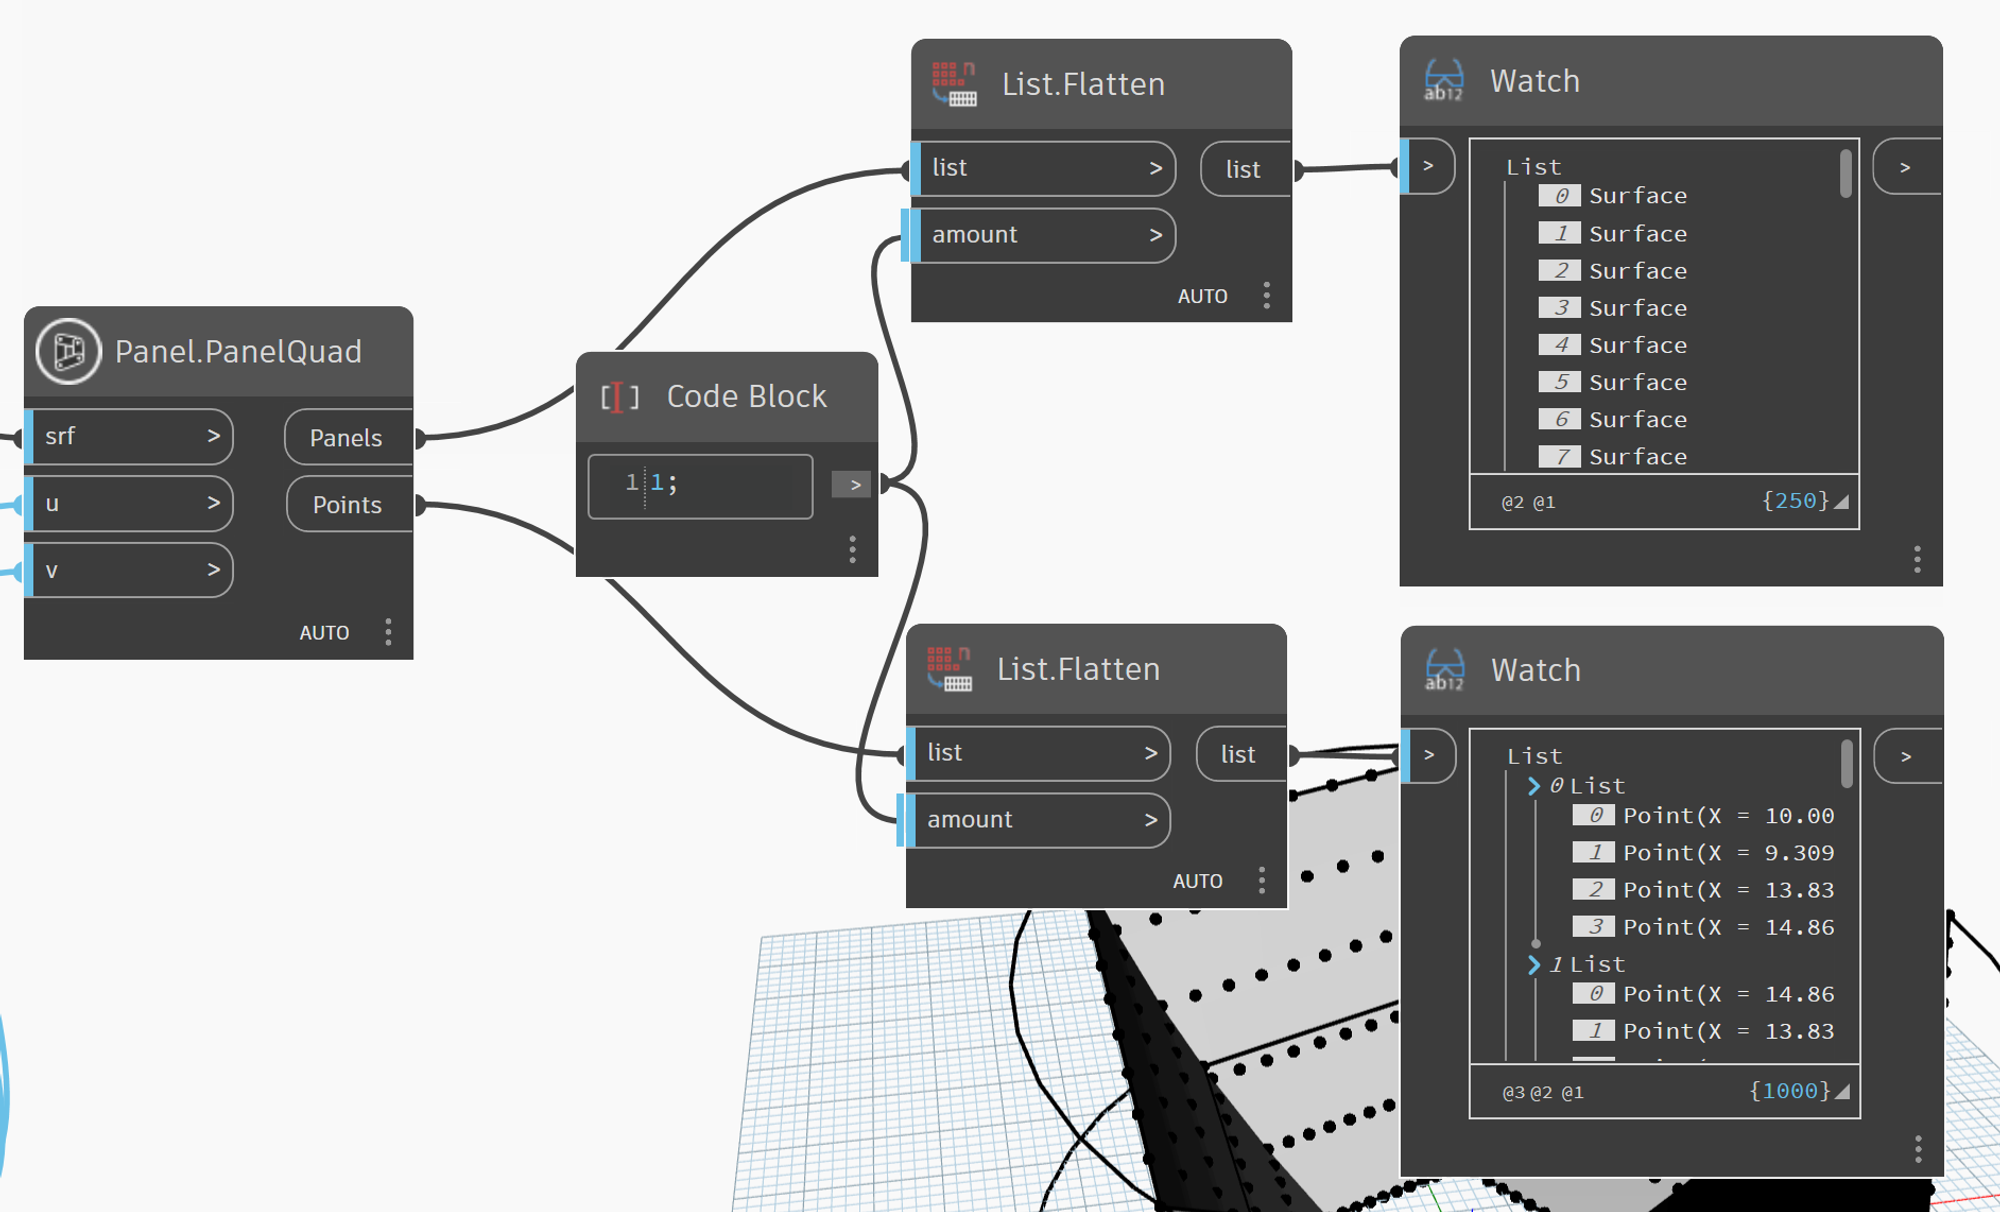
- Add a List.Flatten node to remove 1 level of hierarchy from the output list of Panels.
- Add a similar List.Flatten node to remove 1 level of hierarchy from the output list of panel Points.
- Use the panel points to place adaptive panel components at each wall panel location in Revit.
- Use one of this adaptive panel component family from the CEE 120C/220C Shared Library:
- Rect_Panel with Rotating Shade
- Rotate the adaptive panel placement points to create the desired rotation of the panels.
- Copy the QuadPoint_Rotate custom node from the CEE 120C/220C Shared Library into the same folder as your main Dynamo Graph:
- Place this custom node in your graph and set the inputs as follows:
- listOfQuadPoints = the Points output from Panel.PanelQuad
- desiredRotation
- 0 = No rotation
- 1 = 90 degrees clockwise
- 2 = 180 degrees clockwise
- 3 = 270 degrees clockwise
- Choose the desiredRotation based on the adaptive panel you’re using:
- For the Rect_Panel with Rotating Shade
- Choose 1 to place the hinges on the left side of the panel
- Choose 3 to place the hinges on the right side of the panel
- For Rectangle_Seamless Panel with Folded Surfaces
- Choose 0 or 2 to have the panels fold horizontally.
- Use the output of the QuadPoints_Rotate custom node as the input points for your AdaptiveComponent.ByPoints node.

- Create geometry to represent the shading elements by following the workflows in one of these examples:
- Use the SunSettings.Current and SunSettings.Direction nodes to get a vector representing the sun’s position from your Revit project settings.
- Use the Solar Arc node to compute the sun position for a specific latitude and longitude.
- Provide a slider as input to the Offset parameter to simulate the movement of the sun through the day.
- Add a Sun.Settings.Current node to your main graph to capture the current sun position in your Revit project.
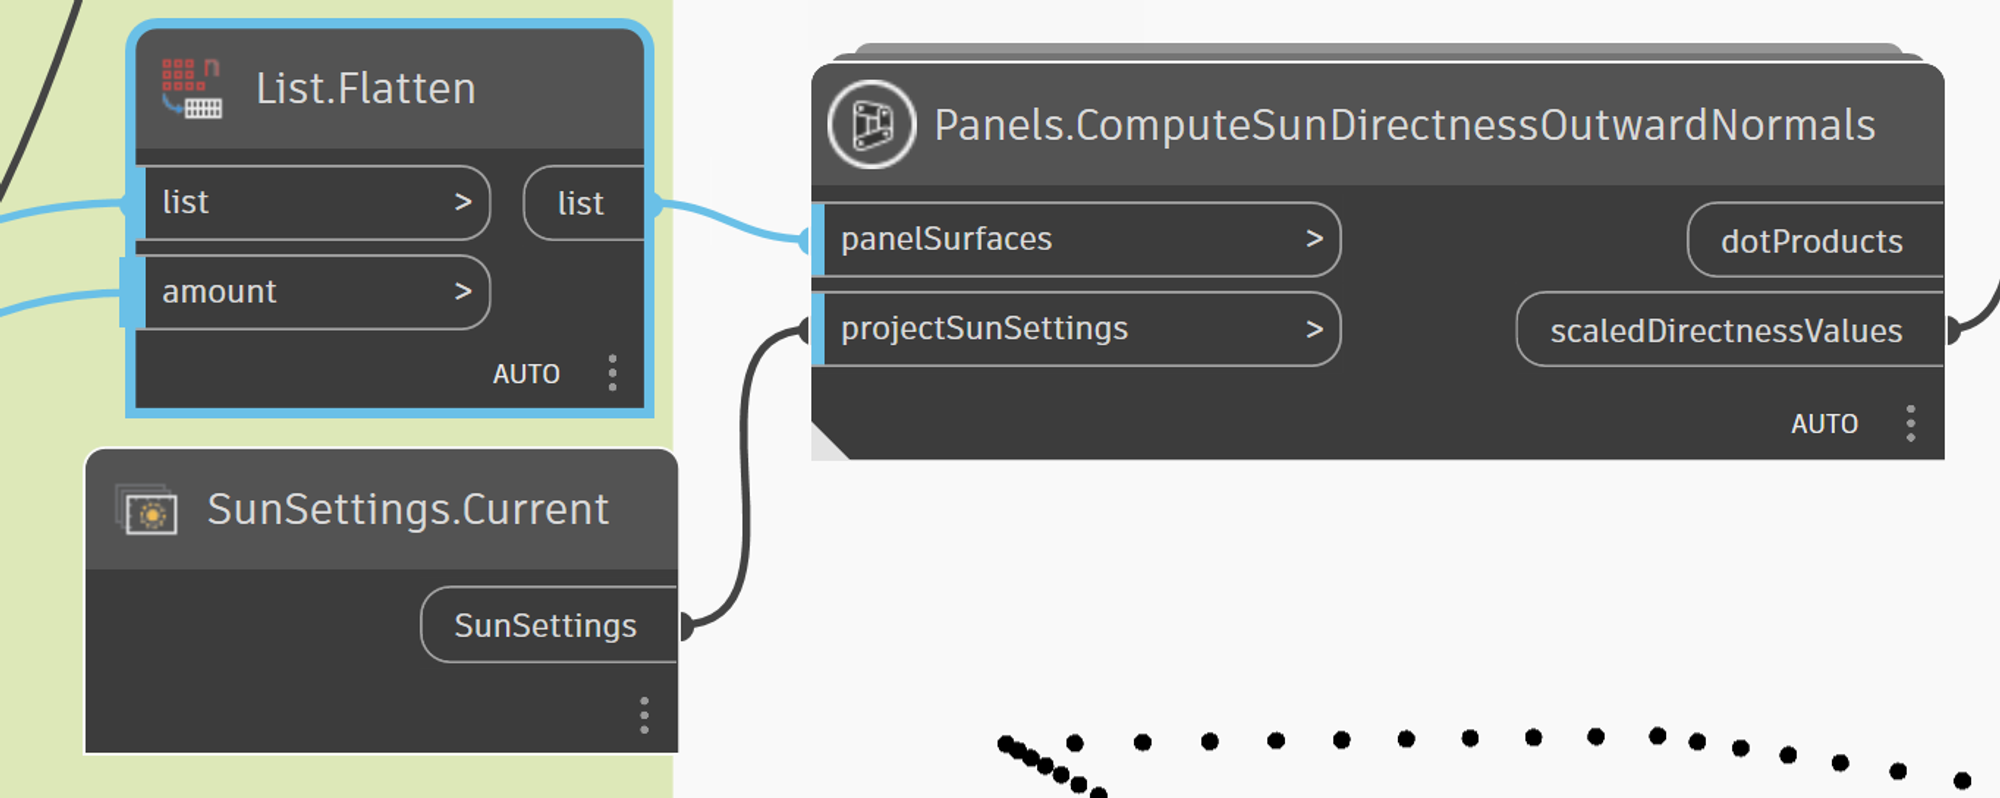
- Create node logic to evaluate the directness of each surface panel to the sun using the dot product logic illustrated in the examples.
- Copy all 3 of these custom nodes from the the CEE 120C/220C Shared Library into the same folder as your main Dynamo graph:
- Use the Panels.ComputeSunDirectnessOutwardNormals.dyf custom node to point all the panel normals toward the outside of the building. This will allow us to evaluate the sun is oriented relative to the outer face of the panels (flipping the normals if needed).
- Input the flattened list of panel surfaces.
- Use the output fro Sun.SettingsCurrent as the input for projectSunSettings.
- This node maps the computed directness values to a new range with:
- 0 representing the least direct orientation.
- 1 representing the most direct orientation.
- Create node logic to map the computed directness values to a range of colors – for example:
- Choose a dark color to indicate the panels with the least direct orientation.
- Chose a bright color to indicate the panels with the most direct orientation.
- Set the color of the surface panel elements based on the computed directness values.
- Adjust the parameters of each panel based on the computed directness values.
- Use the panel points to place adaptive panel components at each wall panel location in Revit.
- Set the instance parameters available, based on the adaptive panel component family used:
- Rect_Panel with Rotating Shade
- Set the Shade Rotation (0 to 89 degrees)
- Set the Shade Width (any positive distance)
- Set the Shade Height to match your panel height
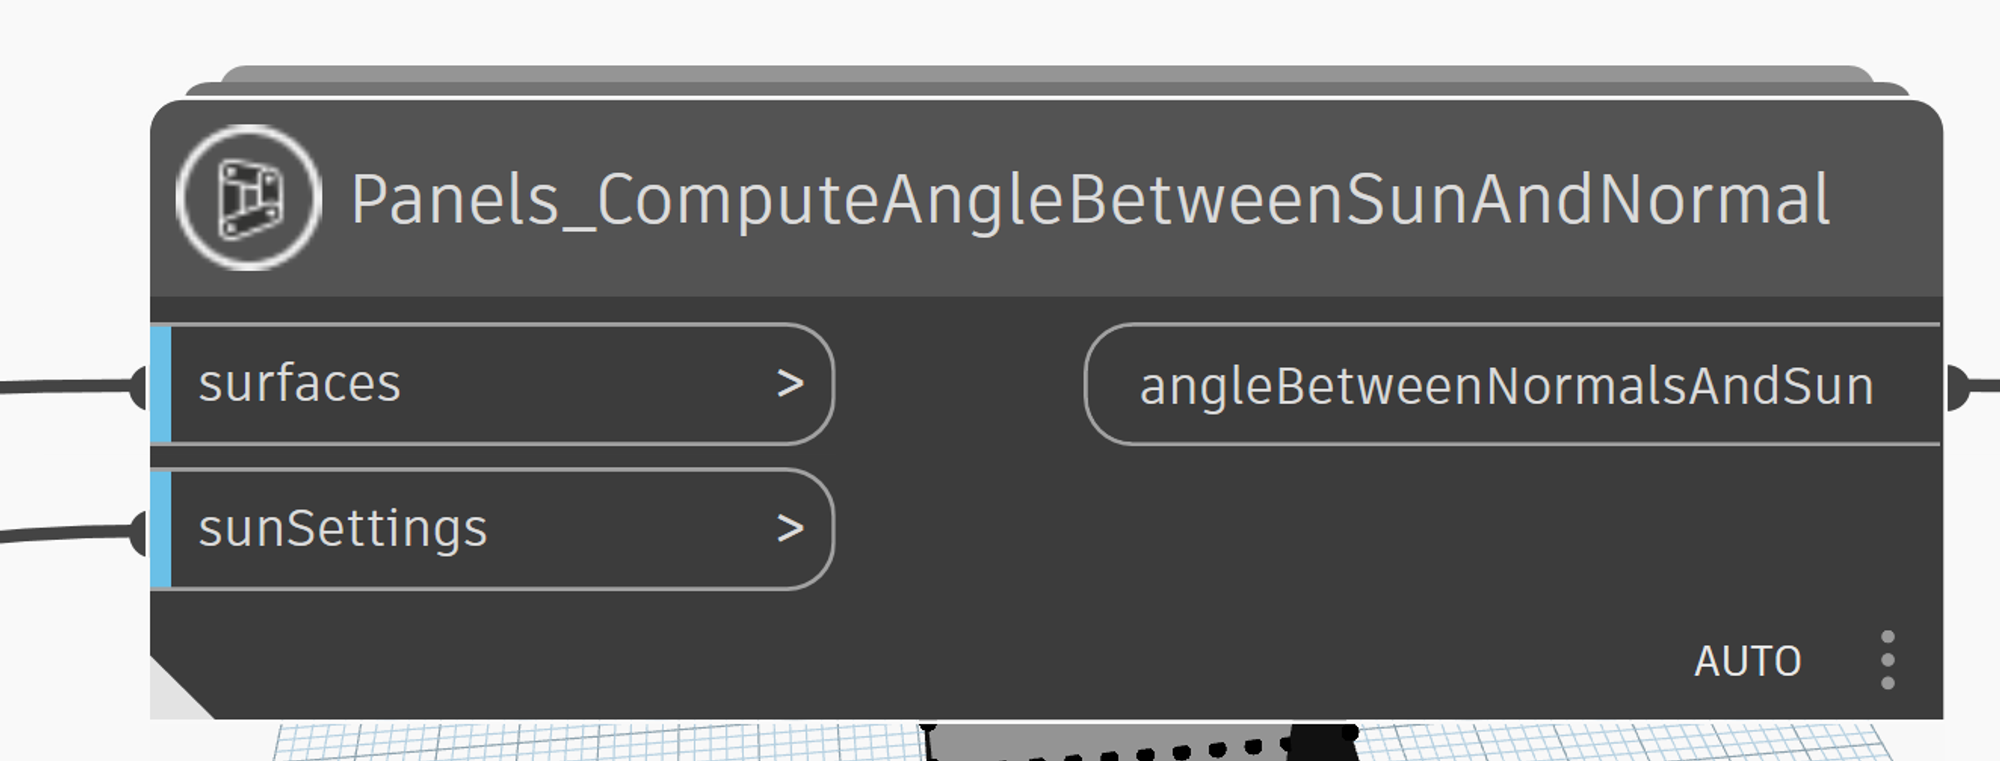
You can input the list of panel surfaces and the SunSettiings.Current, and it will return a list of angle values that you can use to set the Shade Rotation parameter.
If the panel rotation is set to 1 (hinge on the left side), the shades will be rotated 90 degrees to the sun.
If the panel rotation is set to 3 (hinge on the right side), the shades will be rotated toward the sun.
- Adjust the geometry representing the shading elements by following the workflows in one of these examples:
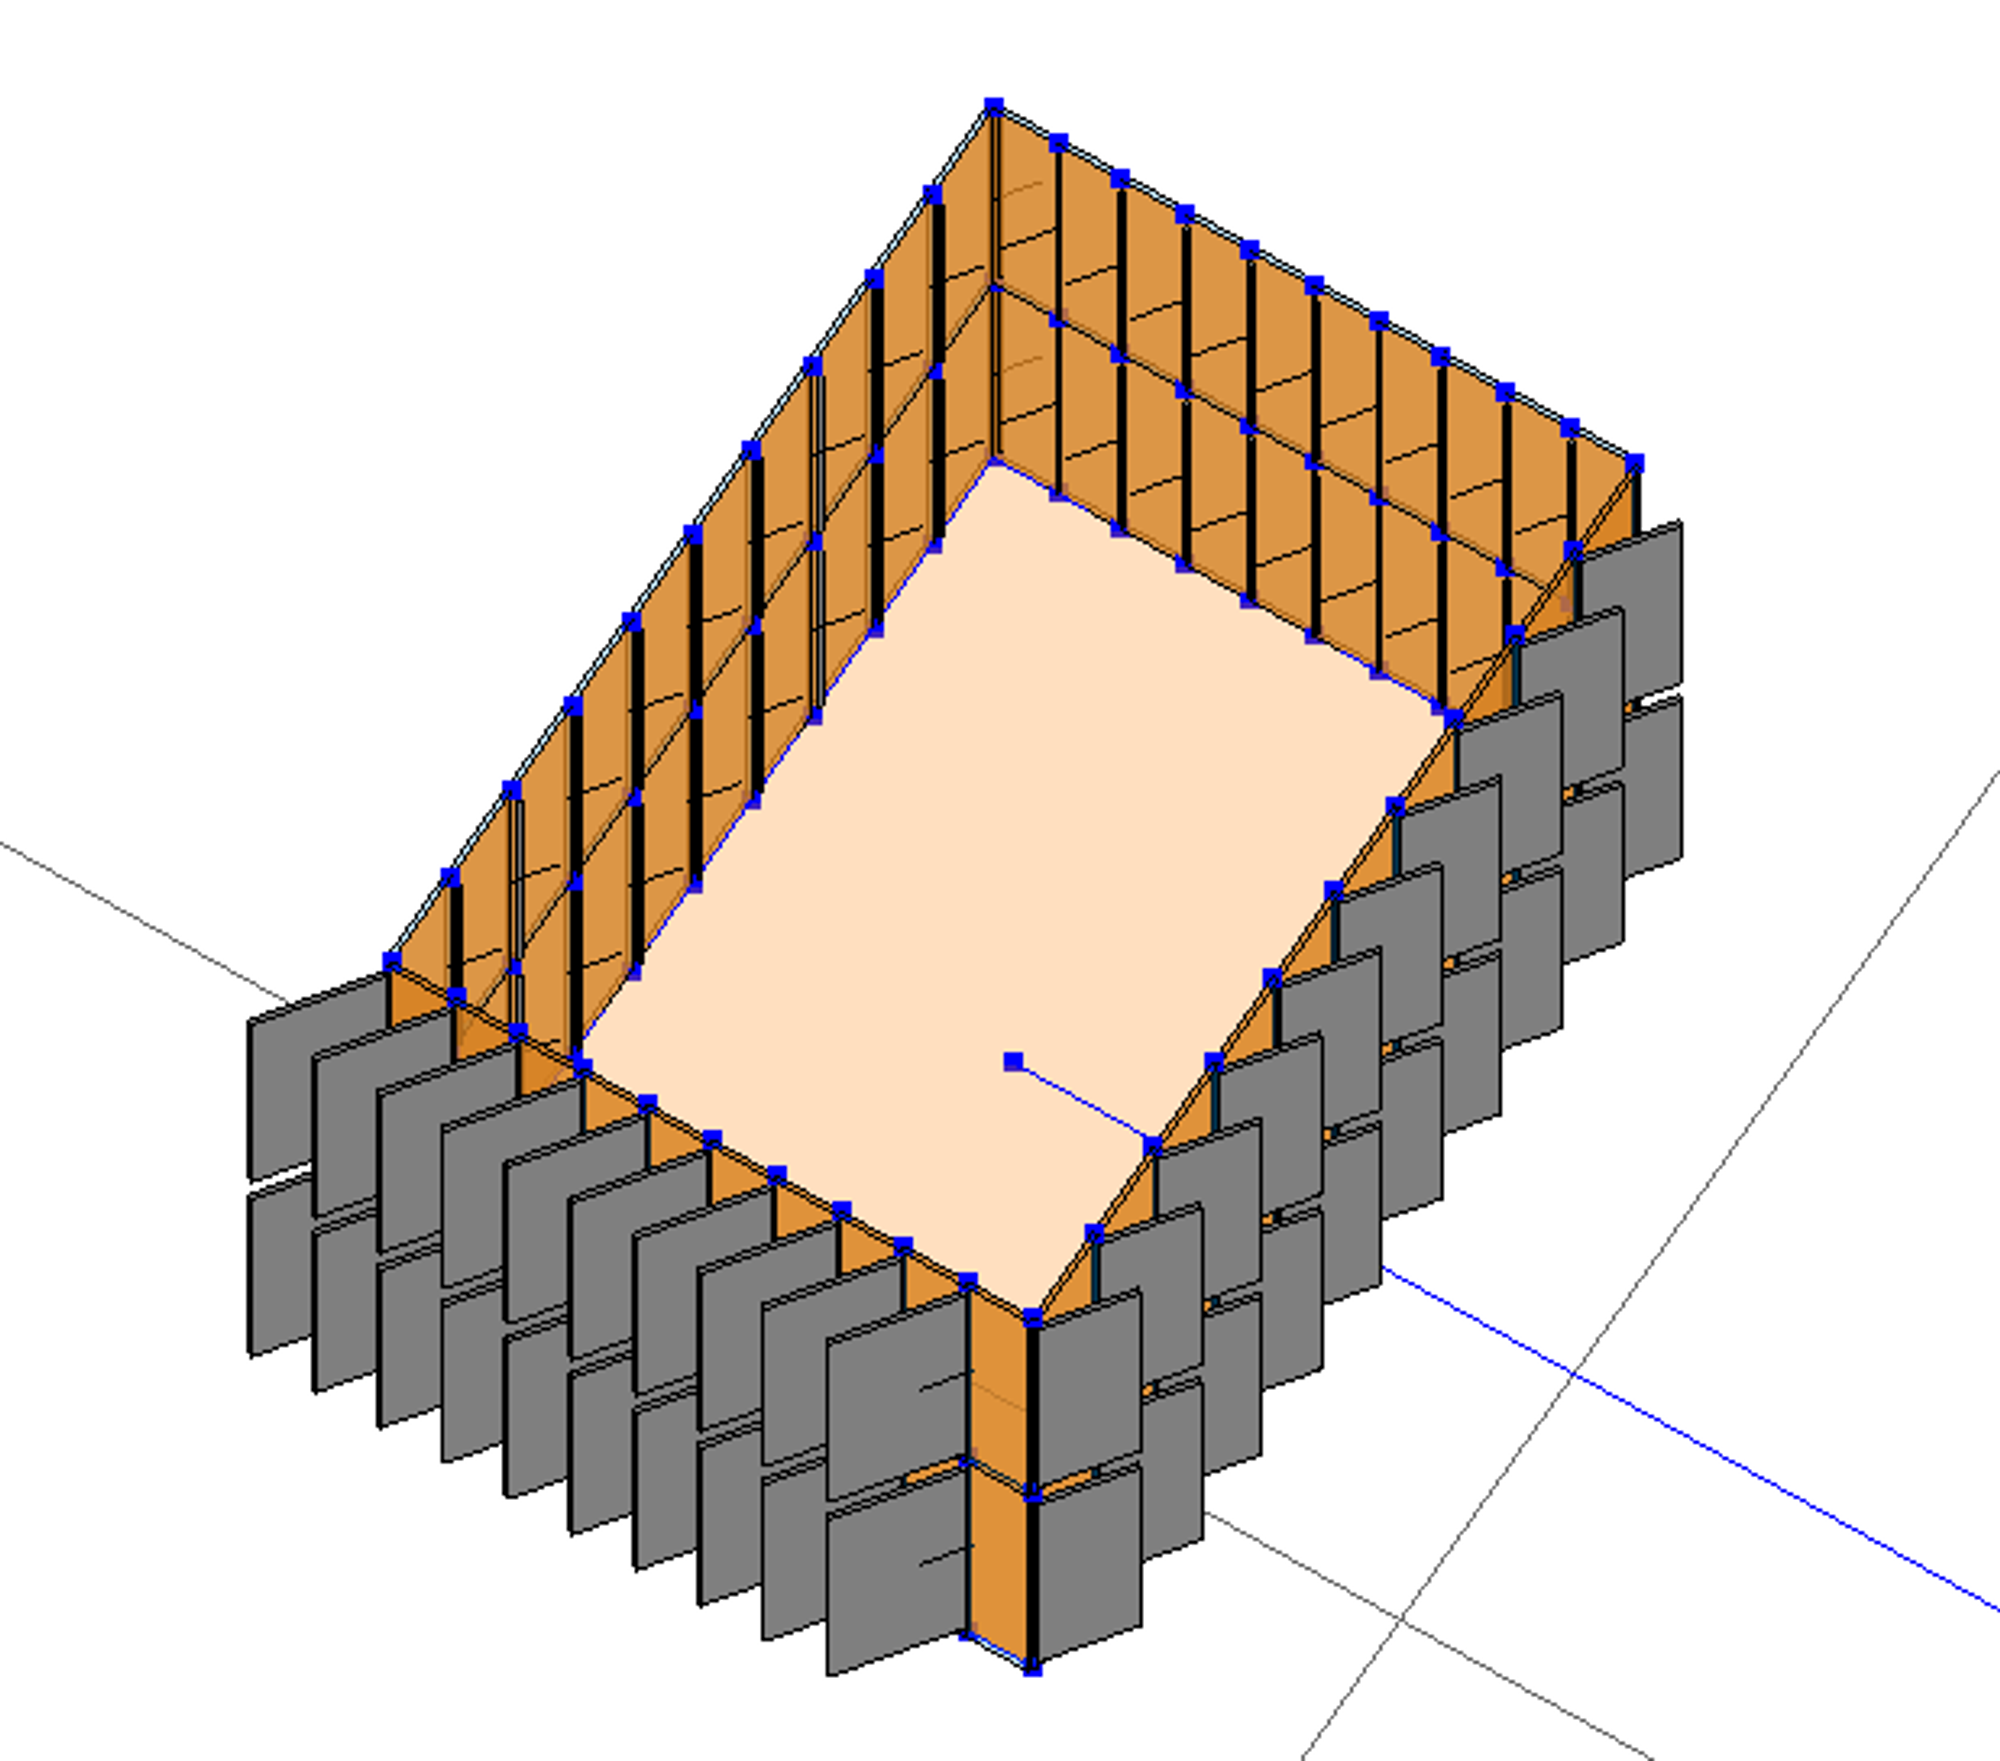
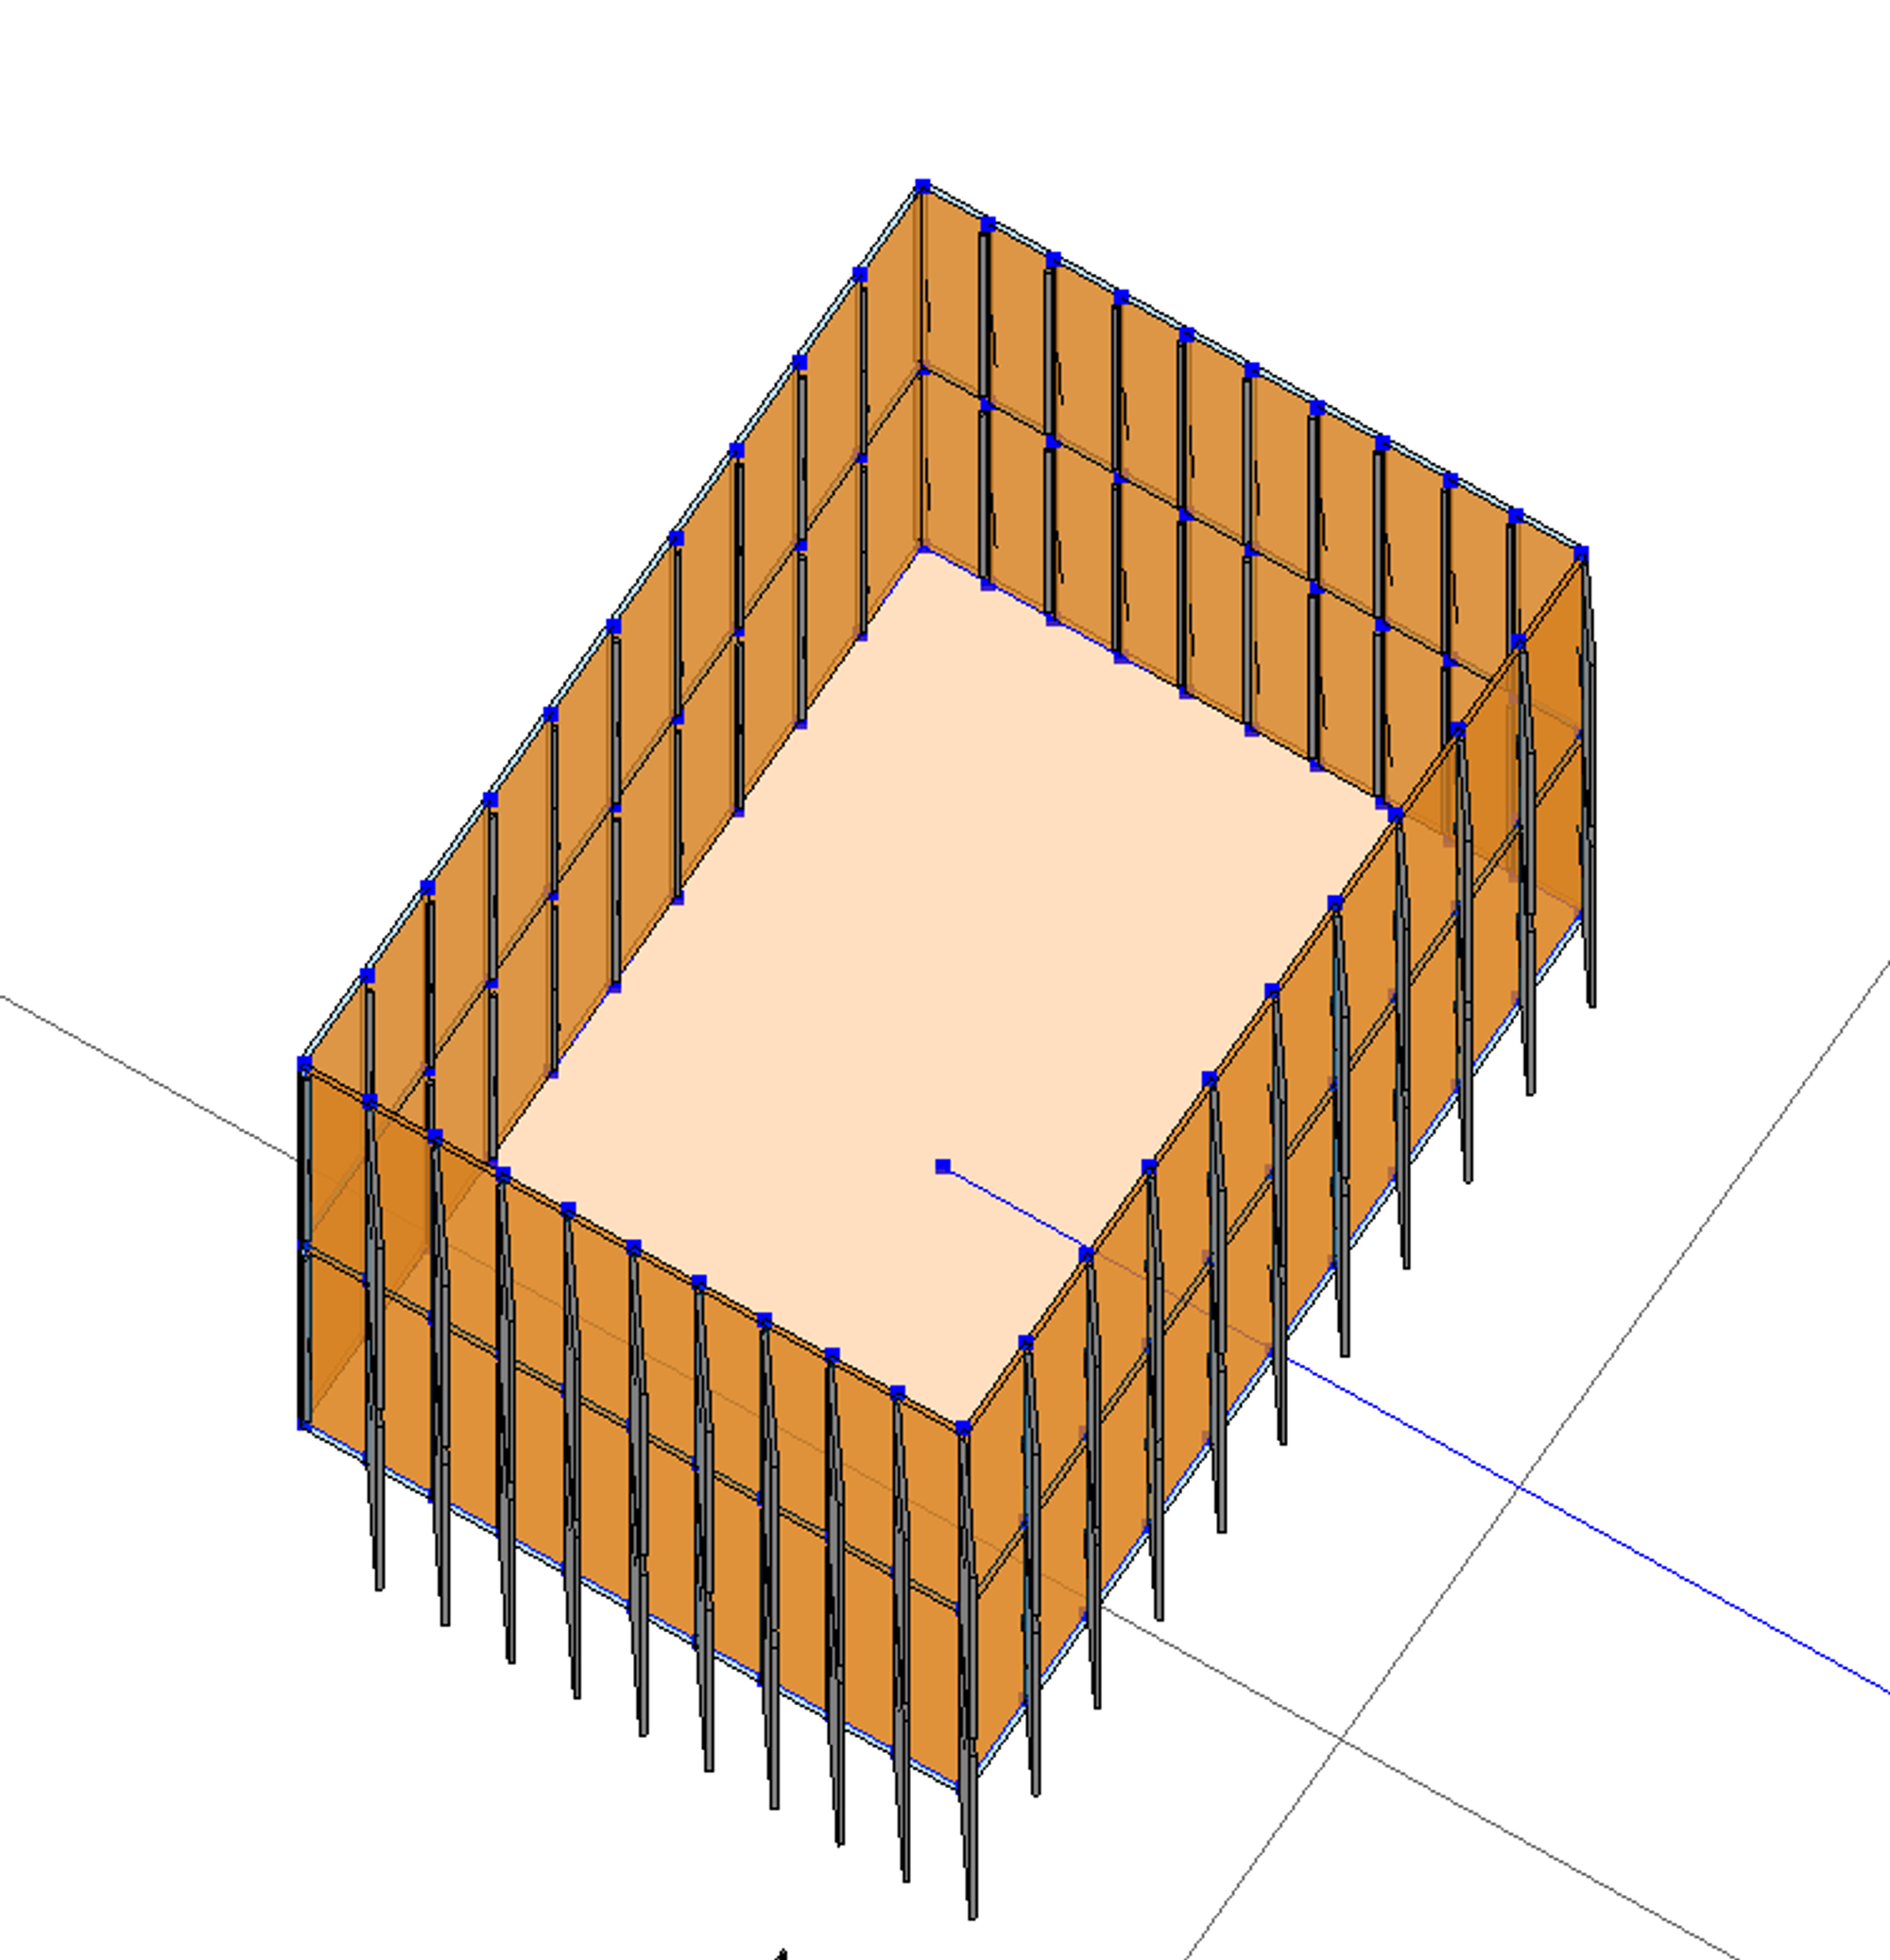
- Save a screenshot showing your model geometry with the wall panels responding to the sun location at two different times of day.
- Save your files for this part of the assignment using a file name that ends with “_Stage2”
Stage 3 - Shield Your Eyes (for 4 units only)
For Stage 3, you’ll create another model of a simple building form and panelize the wall surfaces. Then, follow a similar workflow to evaluate the orientation of the wall panels (relative to the sun position) and use this data to adjust parameters of the wall panels.
For Stage 3, you’ll be using the same logic for computing the directness of each wall panel to the sun. So, you may want to Save As your graph from Stage 2 under a new name and modify it for this stage.
- Provide sliders that will allow users to quickly change:
- the radius of the tower at the lower level
- the number of sides of the polygon
- Provide a sliders that will allow users to quickly change:
- the radius of the tower at the top level
- the height of the top level
- Use the same input for the number of sides for this polygon,
- Translate this polygon in the Z direction to the top level.
- Provide a sliders that will allow users to quickly change:
- the radius of the tower at the mid-level
- Use the same input for the number of sides for this polygon.
- Compute a height for this mid-level, then translate this polygon in the Z direction to this height.
So, we’ll use another strategy:
- Breaking the polygons into a series of line segments.
- Then, grouping and lofting the line segments on each side.
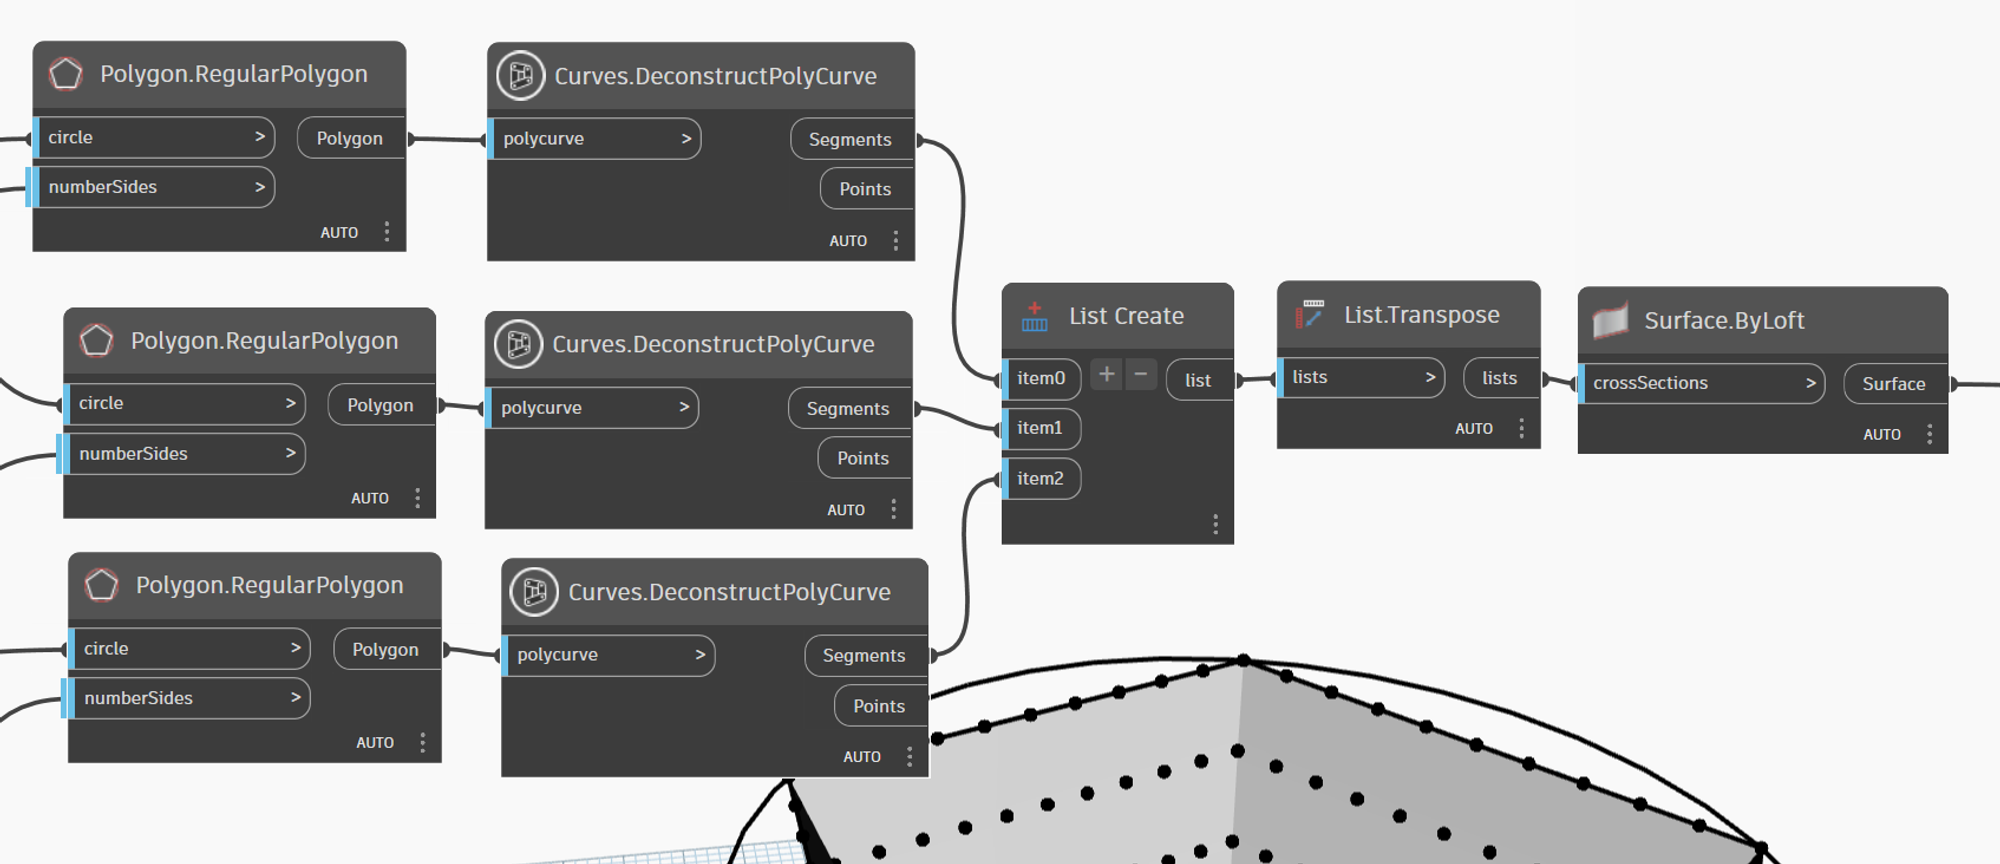
- Use the Curves.DeconstructPolyCurve node to break each polygon into a series of segments — one segment for each side.
- Use List.Create to create a list of these lists of segments.
- Use the Lift.Transpose node to reorganize the lists of segments.
- From 3 lists of 5 segments(if you used a pentagon) at each level.
- To 5 lists of 3 segments on each side.
- Use.Surface.ByLoft to create 5 surfaces — one for each group of segments.
- Option 1: Use the Lunchbox Panel.Triangle node to divide the wall surfaces into triangular panels.
- Set the u and v inputs to create a pattern of hexagonal panels that are about 8’ tall x 8’ wide.
- Option 2: Use the Lunchbox Panel.PanelQuad node to divide the wall surfaces into rectangular panels.
- Set the u and v inputs to create a pattern of rectangular panels that are about 8’ tall.
- Flatten the outputs from the Panel.Triangle or Panel.PanelQuad nodes by one level to combine all of the Panels and Points (from all the sides) into single lists.
- Use the panel points to place adaptive panel components at each wall panel location in Revit.
- Use one of these adaptive panel component families:
- From the CEE 120C/220C Shared Library:
- Rect_Panel with Resizable Opening - 4 pt
- Rect_4 Panel Shutter - 4 pt
- Triangle_Panel with Resizable Opening - 3 pt
- Triangle_Panel - Panels Folding Outward - 3 pt
- Create geometry to represent the shading elements by following the workflows in this example:
- Specify the Sun Settings in your Revit project file.
- Use the SunSettings.Current and SunSettings.Direction nodes to get a vector representing the sun’s position from your Revit project settings.
- Use the Solar Arc node to compute the sun position for a specific latitude and longitude.
- Provide a slider as input to the Offset parameter to simulate the movement of the sun through the day.
- Create node logic to evaluate the directness of each surface panel to the sun.
- Map the computed directness values to a new range with:
- 0 representing the least direct orientation.
- 1 representing the most direct orientation.
- Adjust the parameters of each panel based on the computed directness values.
- Use the panel points to place adaptive panel components at each wall panel location in Revit.
- Set the parameters available, based on the adaptive panel component family used:
- Rect_Panel with Resizable Opening - 4 pt
- Set Panel Frame Width Parameter A (0.02 to 0.49)
- Set the Panel Frame Width Parameter B (0.02 to 0.49)
- Rect_4 Panel Shutter - 4 pt
- Set the Shutter Coverage Parameter (0.02 to 0.49)
- Set the Shutter Maximum Depth (any positive distance)
- Triangle_Panel with Resizable Opening - 3 pt
- Set the Panel Frame Width Parameter (0.02 to 0.49)
- Triangle_Panel - Panels Folding Outward - 3 pt
- Set the Fold Opening Parameter (0.10 to 0.95)
- Set the Maximum Fold Height (any positive distance)
- Adjust the geometry representing the shading elements by following the workflows in this example:
- Save a screenshot showing your model geometry with the wall panels responding to the sun location at two different times of day.
- Save your files for this part of the assignment using a file name that ends with “_Stage3”
Submit
- Please create a folder named “Module 4” within your personal folder in our Autodesk Construction Cloud project.
- Then, upload these items to your Module 4 folder using the web interface:
- Your Revit project (.RVT) file and Dynamo graph (.DYN) file for each stage of the assignment.
- Or, your Grasshopper (.GH) file for each stage of the assignment.
- Create a link to your Module 4 folder:
- Right-click on the Module 4 folder in the file tree (at the left side of the interface) and choose Share from the pull-down menu.
- Choose Share with Project Members, then switch to the Link tab.
- Click the Copy button to copy the link to your clipboard.
- Create a new posting on this Notion page — Design Journal Entry: Rise and Shine — including:
- A screenshot of your model geometry from each part of the assignment that you completed:
- For 2 or More Units: Rise and Shine
- For 3 or More Units: Gonna Need Shades
- For 4 Units: Shield Your Eyes
- A few sentences describing your modeling approach for each stage
- A brief description of your design outlining the parameters that can be used to flex and dynamically change your structure
- The link to your Module 4 folder in our Autodesk Construction Cloud project.