4 units
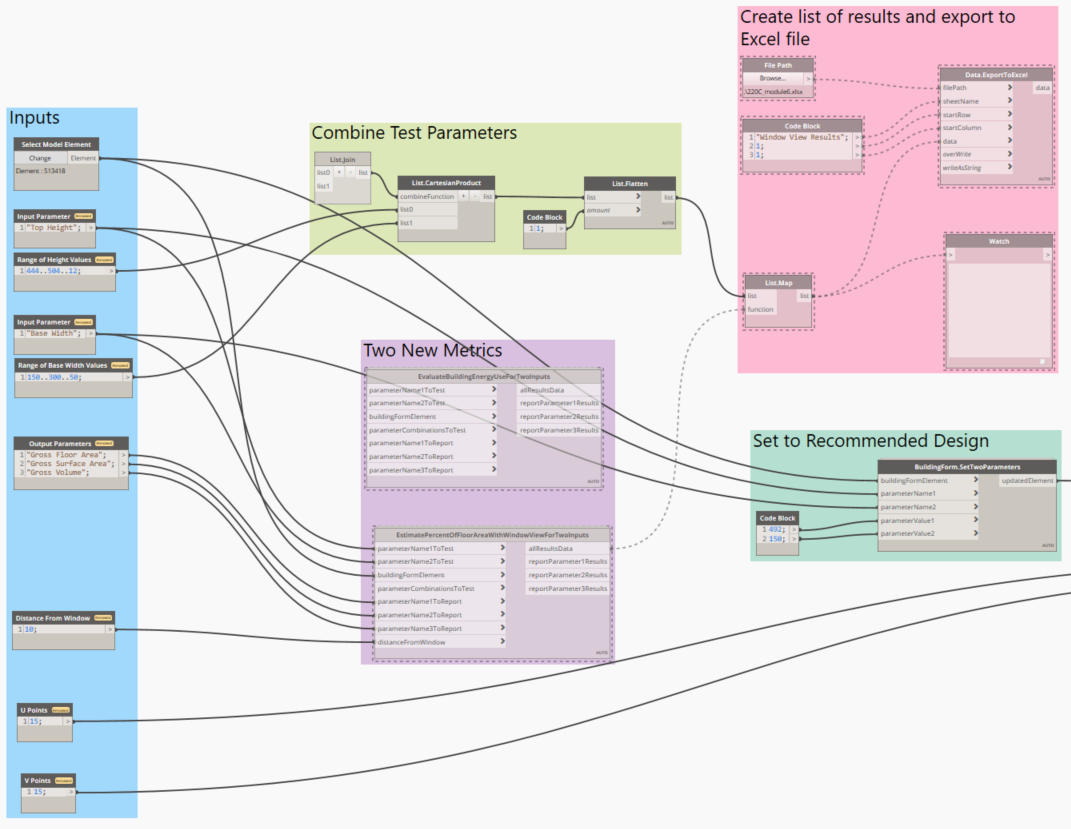
The overall node logic for the first part of the assignment was similar to the node logic from the module 5 assignment. Inputs are the input parameters (top height and base width) and output parameters (floor area, surface area, volume).
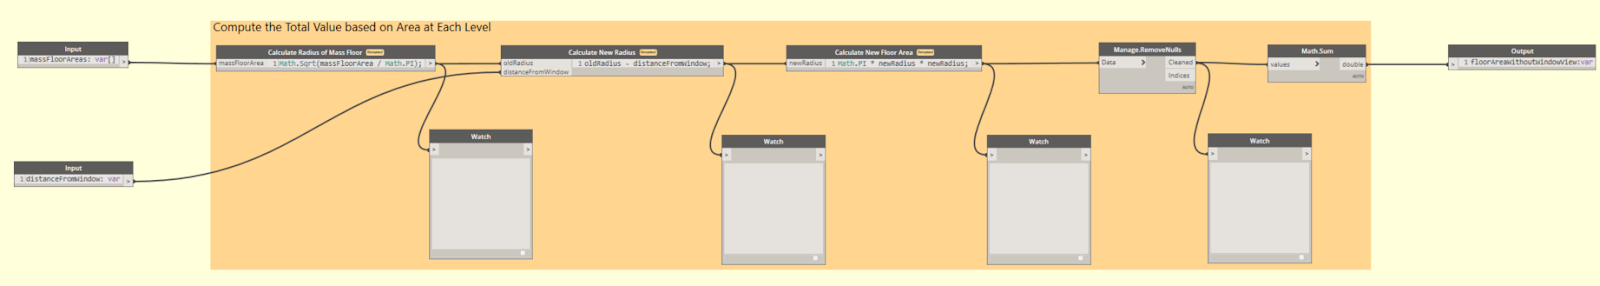
The first metric I chose was the percentage of the building with access to windows within 8 feet. To simplify this analysis, I assumed the shape of my building was circular and that all of the side surface area (i.e. walls) had potential to have windows. To calculate this, I took the area of each mass floor, calculated the corresponding radius, subtracted 10 feet from this radius, calculated the corresponding new floor area, and then subtracted the new floor area from the initial floor area.
To estimate this, I created two custom nodes. The first (EstimateFloorAreaWithoutWindowView) calculates the total floor area that is greater than 10 feet from potential windows.
The second custom node (EstimatePercentOfFloorAreaWithWindowViewForTwoInputs) was adapted from the BuildingForm.EvaluateValueByFloorAreaForTwoInputs custom node. I added a third return parameter and edited the blue node group.
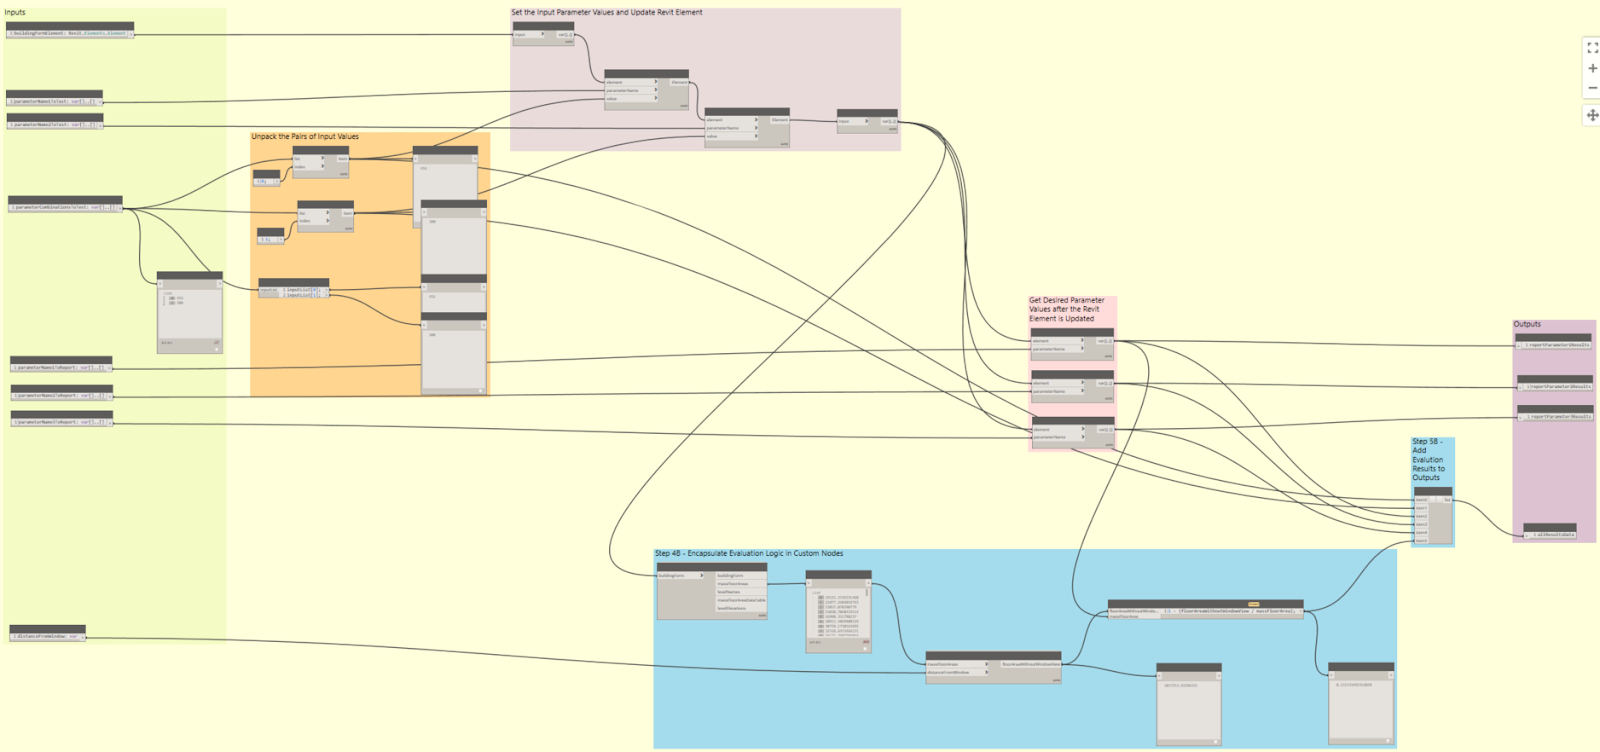
In the blue node group, I added the first custom node I created. Then, I used the total floor area and the area calculated from the custom node to calculate the fraction of floor area that is more than 10 feet away from a potential window.

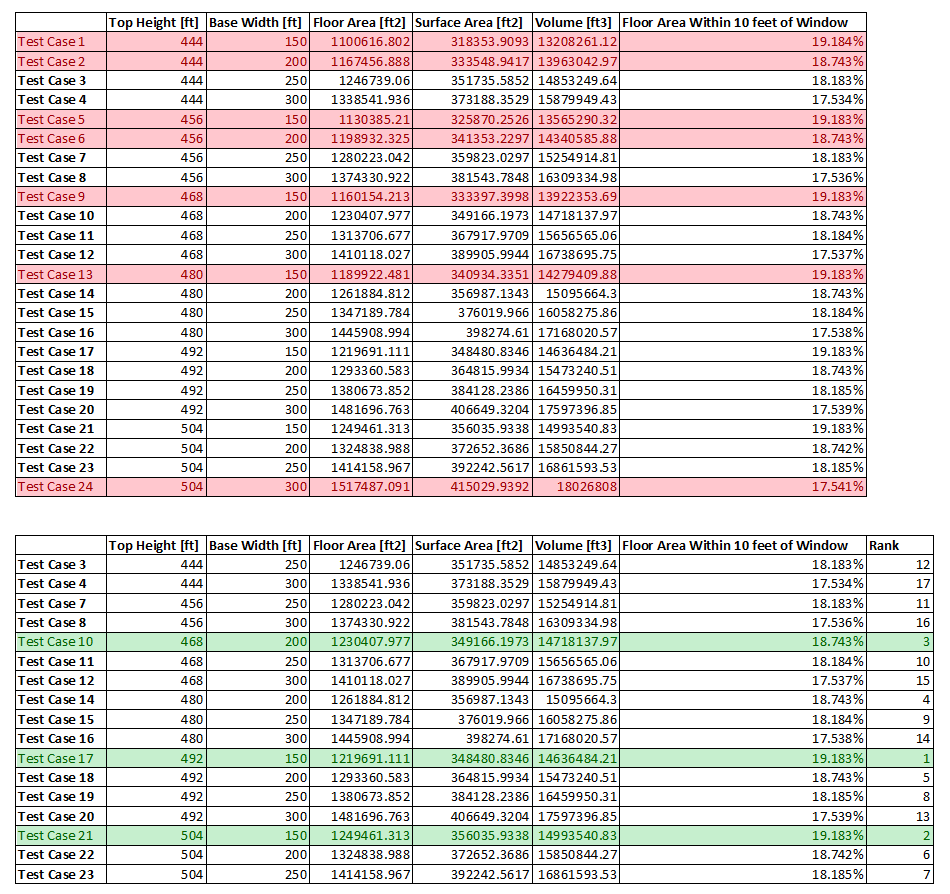
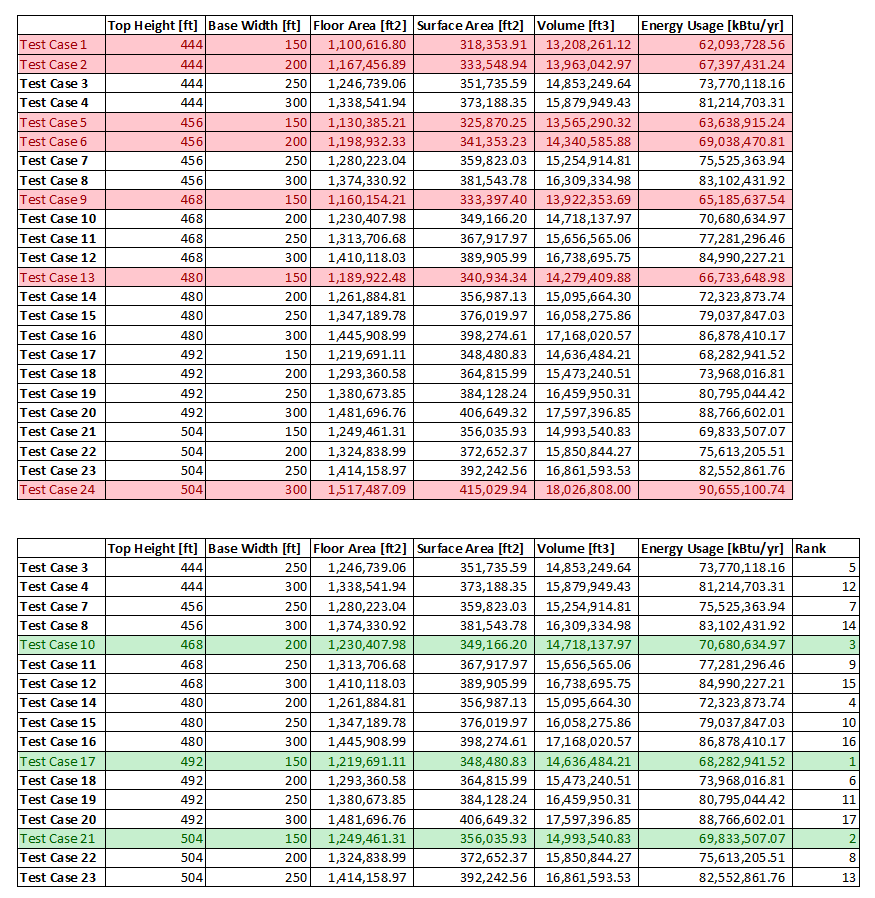
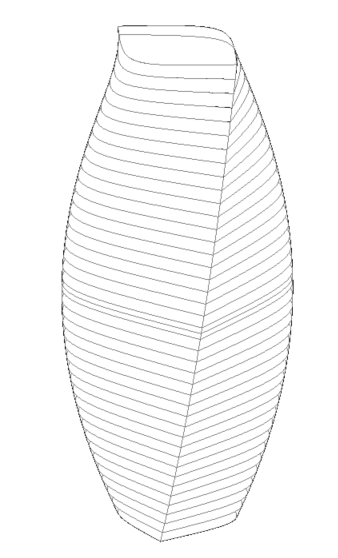
I used the same building structure I created in part 2 of module 5. I then tested top height values between 444 feet and 504 feet and base width values between 150 feet and 300 feet. The first table includes all of the results from the tests, with test cases resulting in a floor area outside of the 1,200,000 to 1,500,000 ft2 range highlighted in red. The second table has those test cases removed and also includes a column with rankings based on the percent of floor area within 10 feet of a potential window. Greater values are ranked higher (with the top three test cases highlighted in green) because a higher percent of floor area with a view of a window will increase occupant wellness.
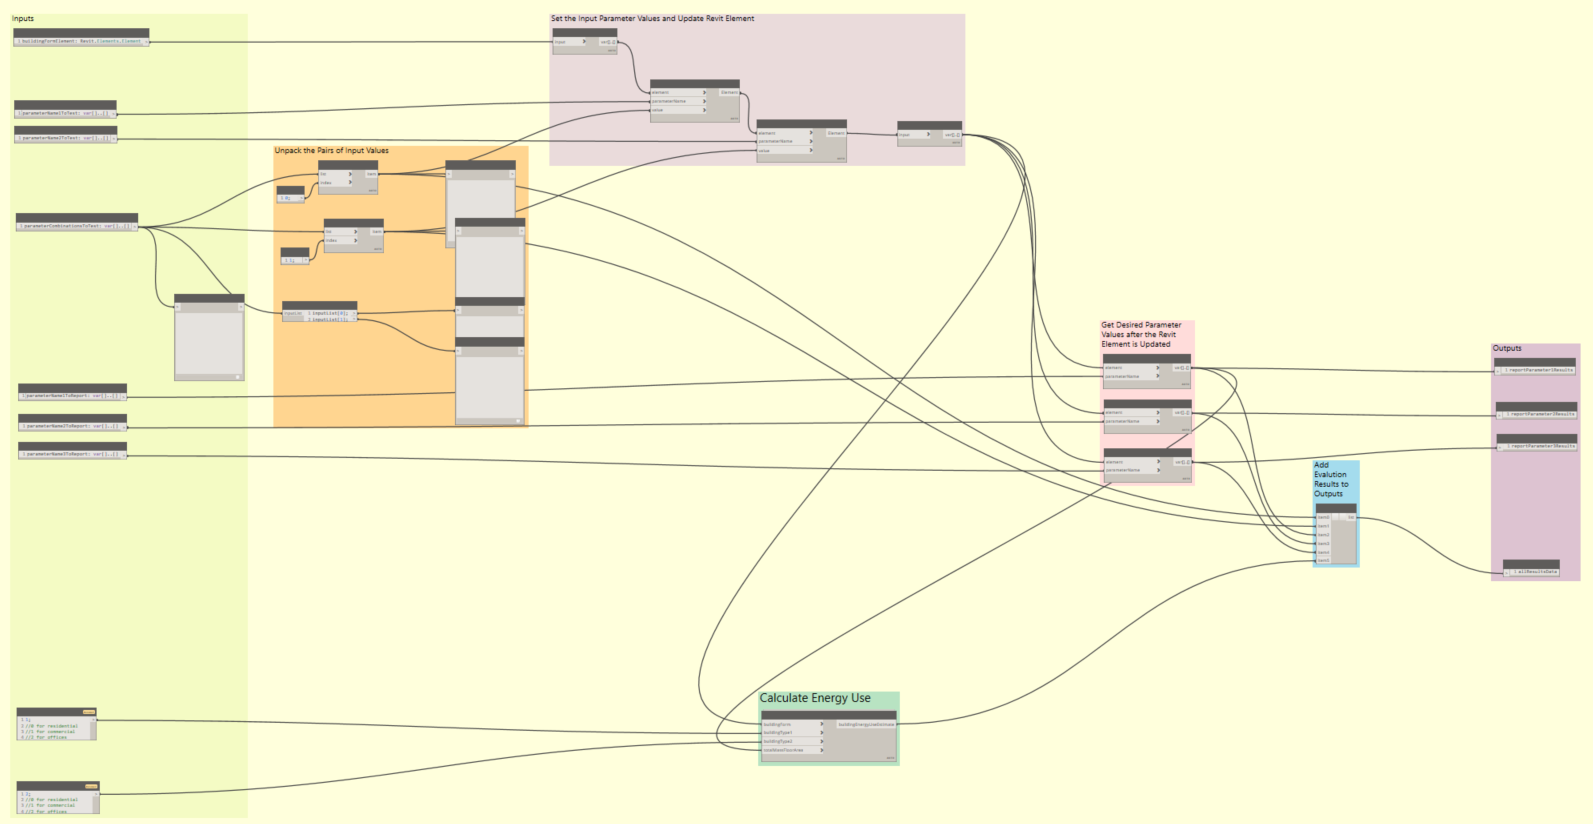
The second metric is estimated energy consumption. Assumptions for this include that it is a mixed-use building with retail on the bottom 5 floors and office space on all of the other floors. I used the site energy values from the “U.S. Energy Use Intensity by Property Type” table from EnergyStar. I decided to provide values for three property types: residential, commercial, and offices. I used 52.9 kBtu/ft2 for the offices, 63.6 kBtu/ft2 for residential (from category Other - Lodging/Residential), and 101.6 kBtu/ft2 for the commercial (from the category Other - Mall).
https://portfoliomanager.energystar.gov/pdf/reference/US%20National%20Median%20Table.pdf
I created three custom nodes to calculate this metric. The first is CalculateAreaOfFirstFiveFloors, which takes the first five mass floors and sums up their floor area.

The second custom node is EstimateBuildingEnergyUseByFloorArea. This node takes the area of the first five floors and multiplies it by the EUI for the corresponding building use type, takes the area of the remaining floors and multiplies it by the EUI for the corresponding building type, and then adds these two values to come up with an estimated energy use for the whole building.
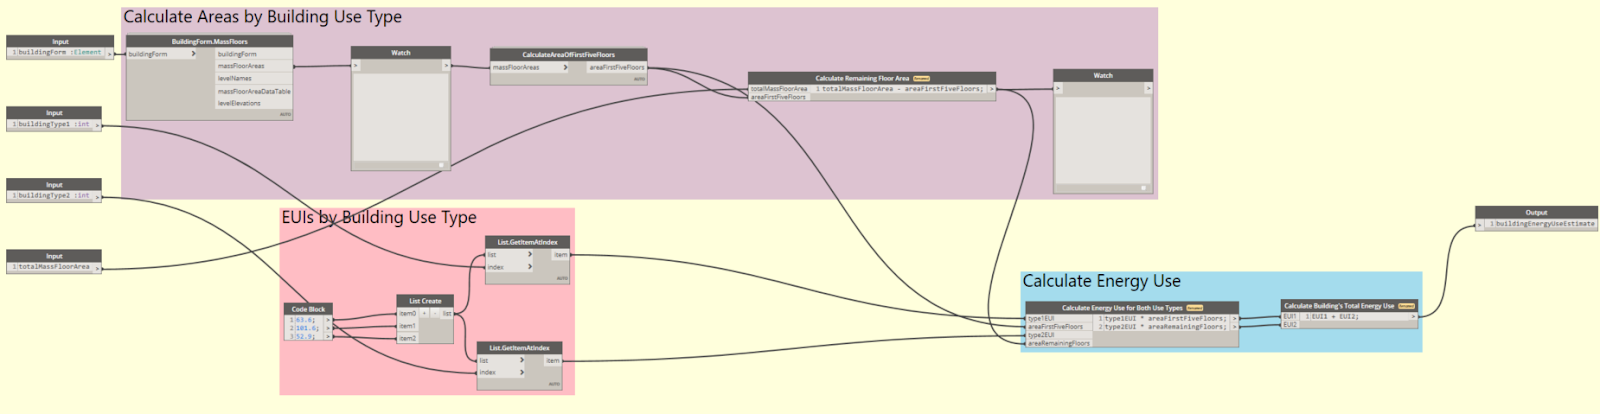
The third custom node (EvaluateBuildingEnergyUseForTwoInputs) was adapted from the BuildingForm.EvaluateValueByFloorAreaForTwoInputs custom node. I added a third return parameter and incorporated the EstimateBuildingEnergyUseByFloorArea custom node.
Within the custom node, the building use type can be changed for each set of floors.

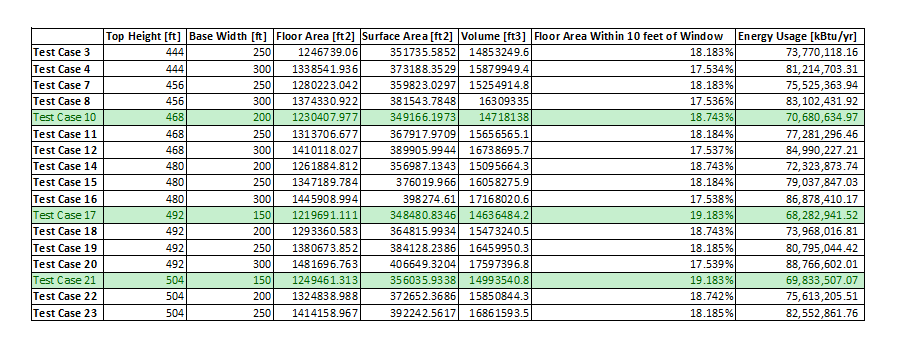
I tested the same values and structure as for the first metric. The first table includes all of the results from the tests, with test cases resulting in a floor area outside of the 1,200,000 to 1,500,000 ft2 range highlighted in red. The second table has those test cases removed and also includes a column with rankings based on the estimated energy usage. Lower values are ranked higher (with the top three test cases highlighted in green) because lower energy use will result in lower energy costs and less environmental impact.
The table below includes all of the options that fall within the constraints. Both metrics resulted in the same top three test cases, likely due to both being related to floor area.
The top ranked test case (#17) was the one with a top height of 492 feet and a base width of 150 feet. It has a floor area of just over 1.2 million ft2, the lowest estimated energy usage, and is tied for the highest percent floor area within 10 feet of a potential window.

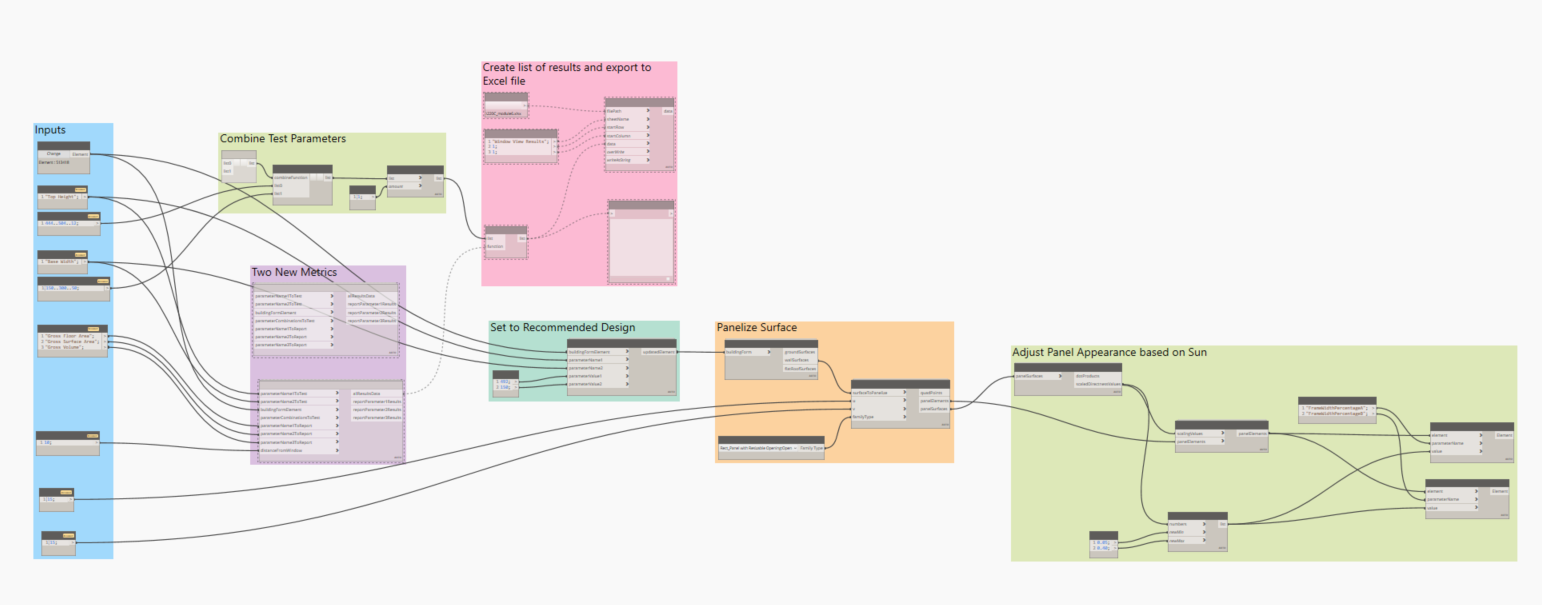
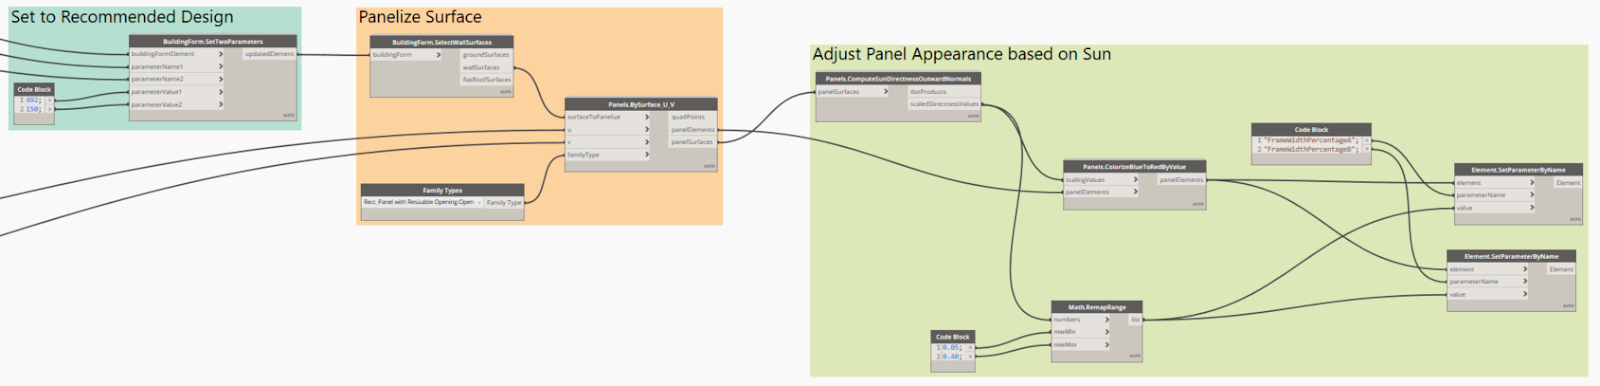
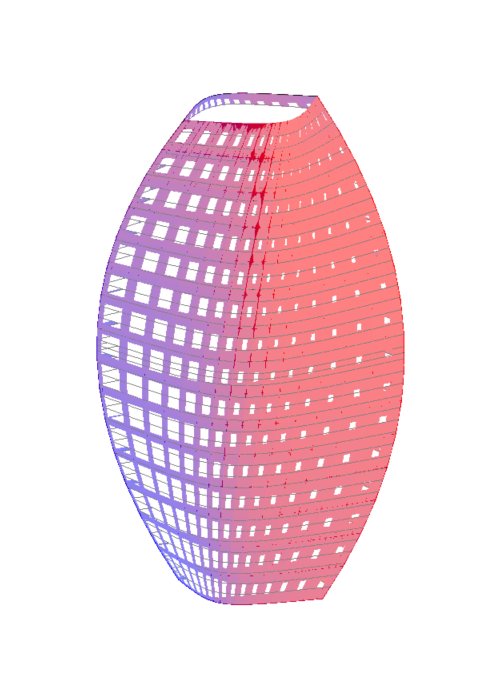
Below is the node logic used to set the form to the optimal parameters, panelize the surface, and adjust the panels’ colors and frame width percentage based on their directness to the sun.