4 units
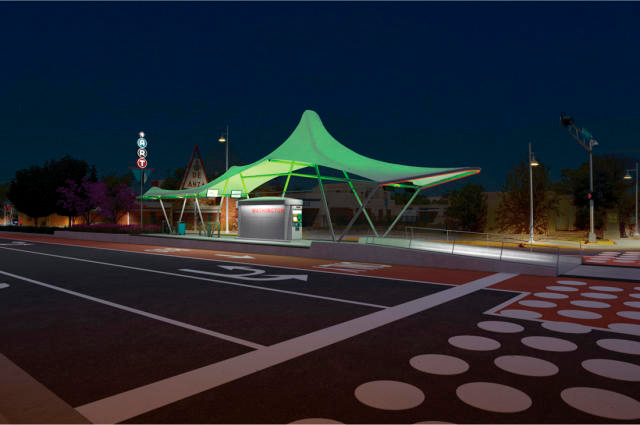
My initial inspiration for this assignment came from the ABQ ART bus stops in Albuquerque, NM (pictured below).

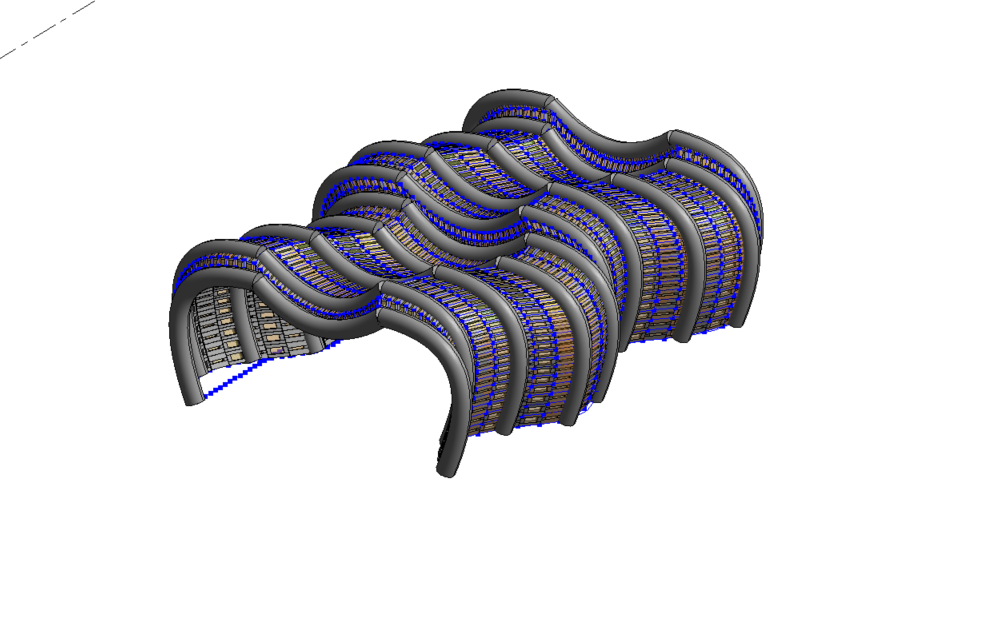
My initial design had a trough in the middle, two lines at the ends, and lines at the midpoints between these to create a tent-like structure that was a simplified version of the bus stops pictured above. After adding beams, panels, and several ways to parametrically change the design, this is what the structure looks like:


/w=640,quality=90,fit=scale-down)
These are the input parameters. They include changing the heights of the different lines that make up the structure, the number of points that make up the grid for the panels (which affects the number and size of the panels), the number of bays/tubes, the properties of the lines which follow a sin curve, and the frame width percentage of the panels.
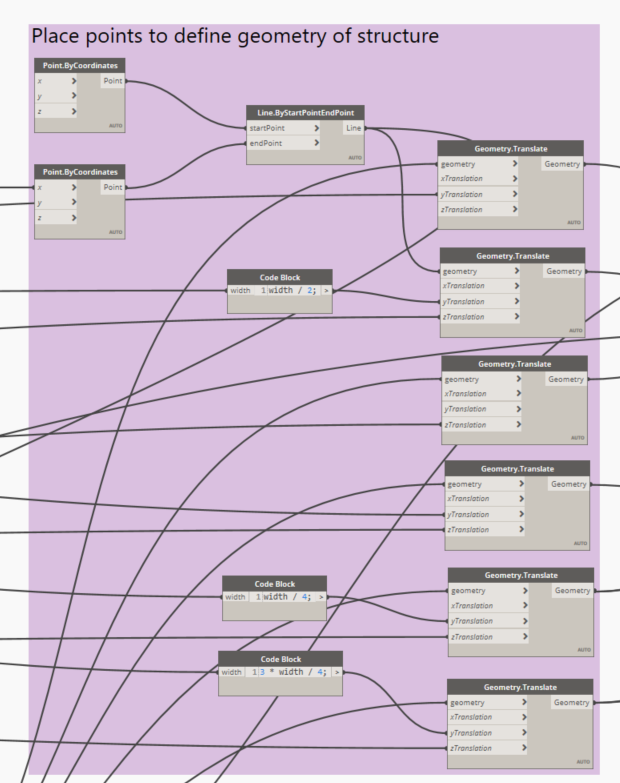
This section of code creates the lines that make up the structure. There are two lines placed parallel to one another on the ground. The input parameter “length” can be used to adjust the length of the lines, and “width” changes the lines’ distance from one another. The command Geometry.Translate is used to create more lines: two “end” lines above the initial two ground lines, one between these two new lines, and two “peak” lines between the end lines and the middle line. The heights of these 5 lines can be changed in the input parameter section.

This section of the code creates the sin wave that the lines making up the structure follow. Curve.PointAtParamter is used to create a number of points along the line. The x-, y-, and z-values of the points are taken, and the y-values are adjusted based on the output from Math.Sin. The number of waves and wave amplitude are input parameters.

This section creates curves based on the lines that have been created. I made three curves. One connects a ground line to the end line above it and finally to the “peak” line (the one between the end line and the middle line). Another connects the same lines but on the other side of the structure. The final one connects the middle line to the two “peaks”.
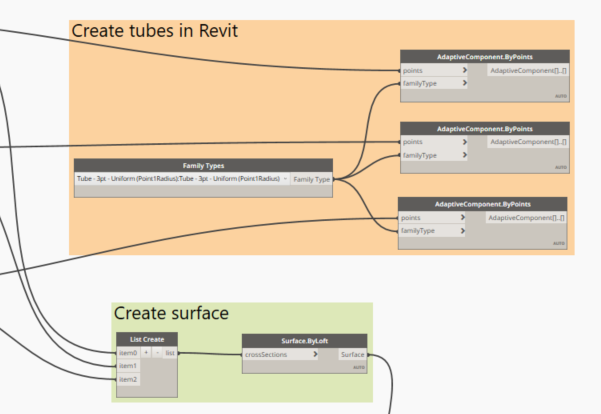
The orange section creates the tubes that make up the bays using the curves that were created above.
The green section creates a list of the curves and then uses this list to make a surface.
/w=1920,quality=90,fit=scale-down)
The teal section uses LunchBox Quad Grid by Face to divide the surface into a quad grid (where the number of points are input parameters).
The grey section creates the Adaptive Panels using this grid.
/w=1920,quality=90,fit=scale-down)
The final section allows the opening of the panels to be adjusted. The panels are divided into two groups: even rows and odd rows. The frame width percentage for each group can be adjusted independent of the other in the input section.
Here are a couple of images with the length of the structure, number of sin waves, and height of the middle line increased.
/w=1920,quality=90,fit=scale-down)
/w=3840,quality=90,fit=scale-down)
/w=3840,quality=90,fit=scale-down)