Workflow
‣
Opening the System Browser
- Press F9, or go to View tab → User Interface → System Browser.
- It opens as a dockable pane. Widen it so you can see all the columns.
- Keep a 3D view or plan view of the power or lighting systems open beside it, zoomed to fit. That way you can see which components you're inspecting.
‣
Setting Up the View
- Use the filters at the top to show Systems .
- Set the discipline filter to Electrical. You can also show All to see how equipment connects across disciplines.
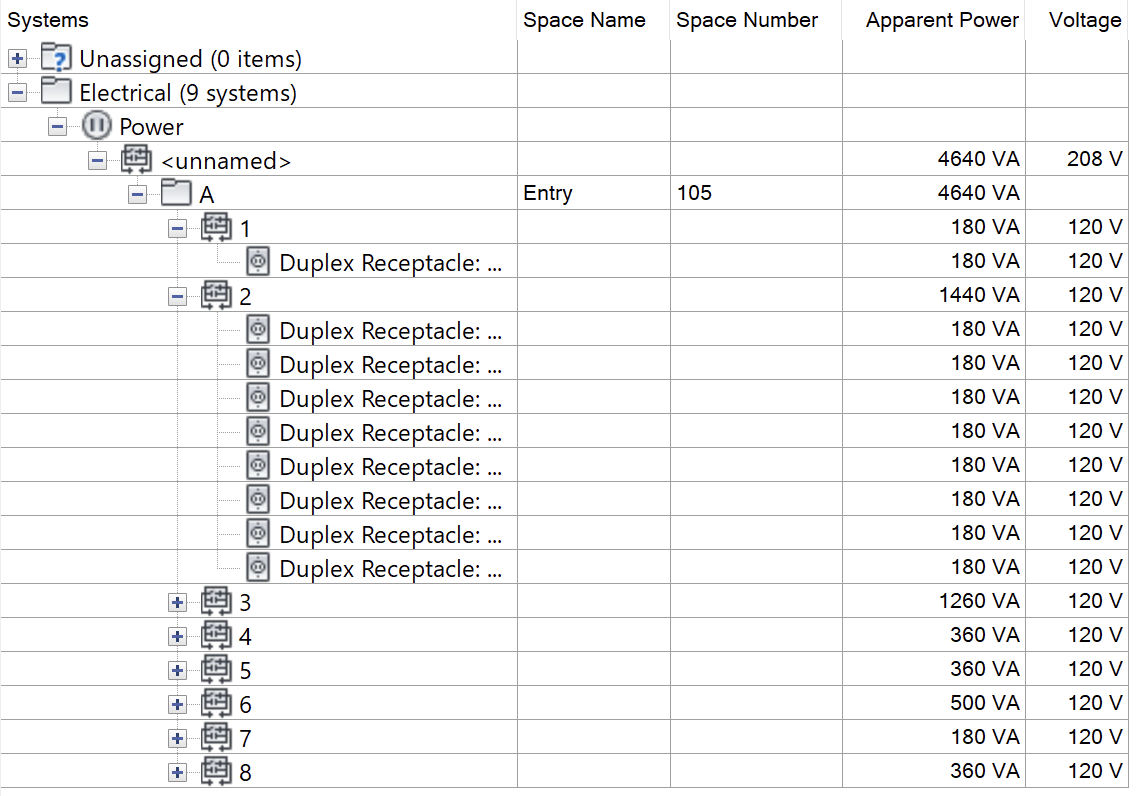
- Expand the tree to see the hierarchy:
- system classification (e.g., Power Lighting)
- then, each named or <unnamed> system
- then, panels in that system
- then circuits connected to that panel
- then, individual devices connected in that circuit
‣
Reading the Information
- Each component row shows key data such as apparent power, voltage, and the associated space. The apparent power is driven by devices connected.
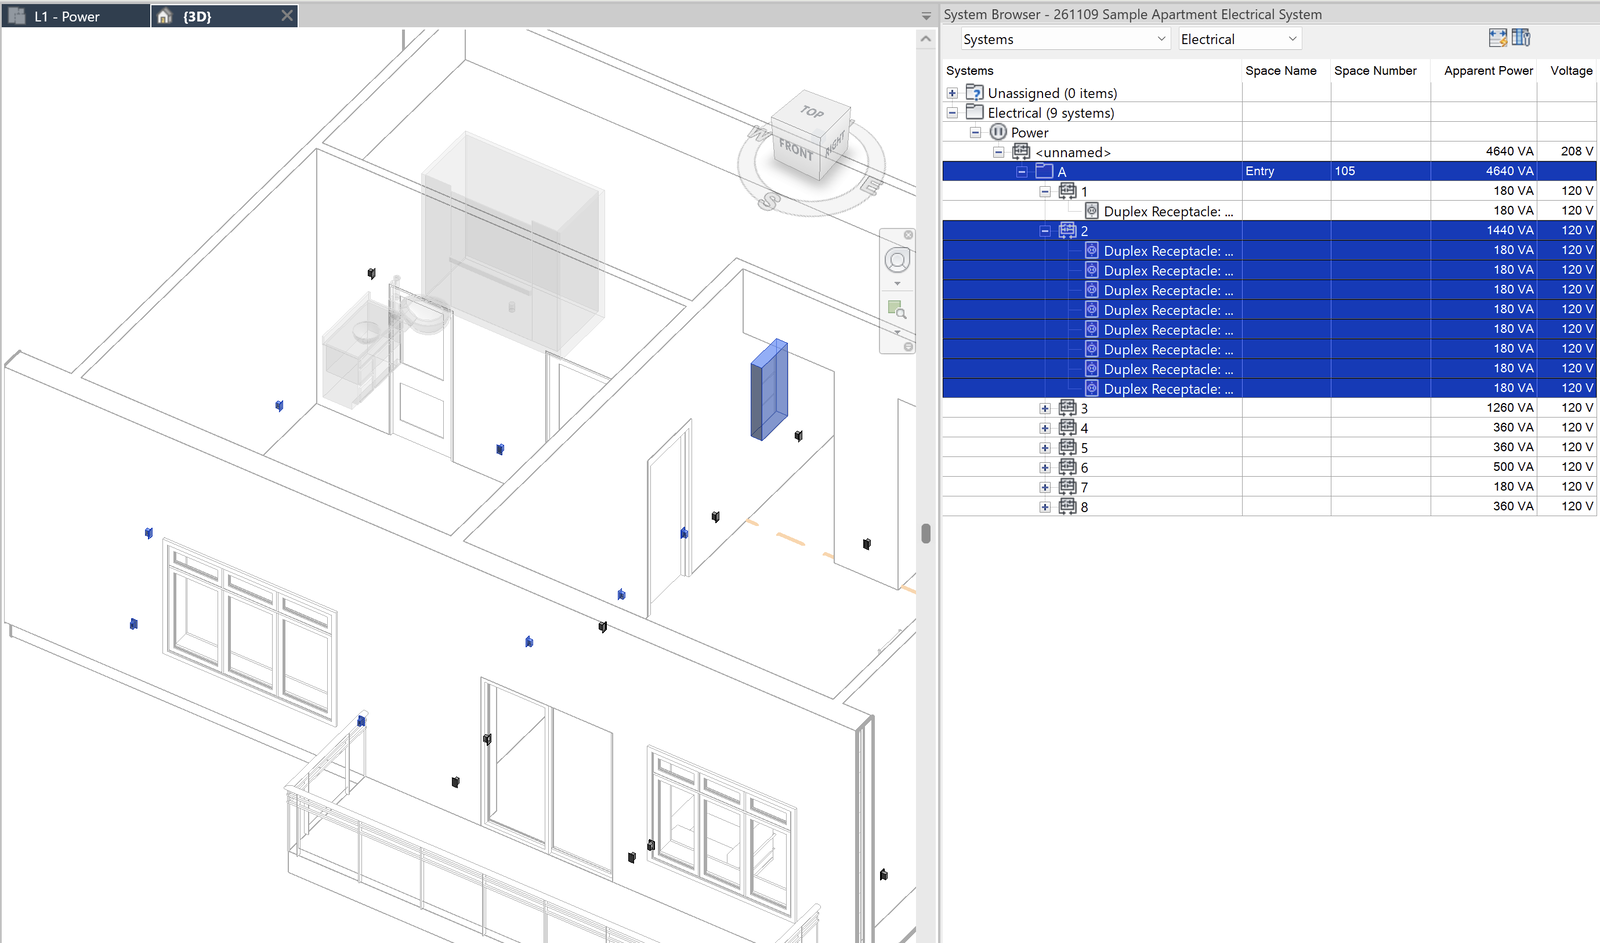
- Select any row to highlight that element in the model. For example:
- Selecting one panel, receptacle, or terminal unit highlights it in blue.
- Right-click on the row, then choose Show to zoom in to it.
- Select a circuit, then right-click on the row and choose Show Members to select all the devices connect to it in the System Browser and the model view.
‣
Testing How Loads Roll Up
- Add another device to a circuit.
- Watch the system total update in the browser.
- Use this to:
- confirm totals match your design intent.
- reallocate components between systems if needed.
- If totals don't roll up the way you expect, something probably isn't connected the way you think.
‣
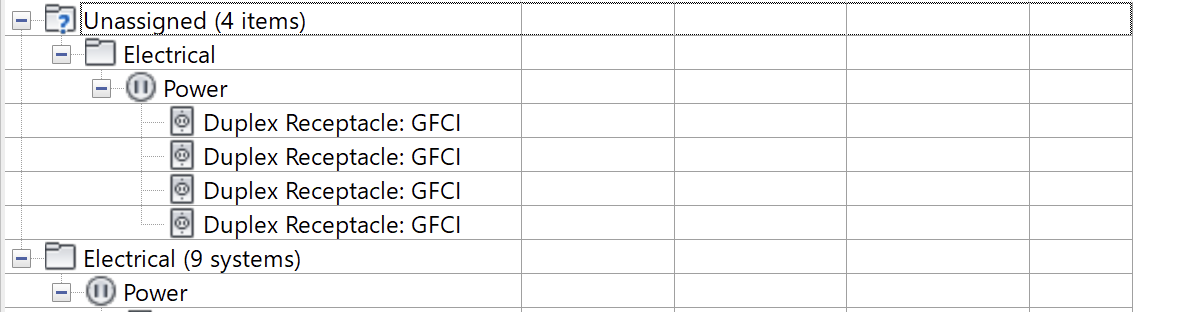
Understanding the "Unassigned" Section
- Any device that isn't part of a system appears under Unassigned.
- A device that should be in a system but appears here usually means it was missed during circuiting or added later. Fix it before you move on.