Step 1 - Generative Design Framework
A very brief description of the design decisions from Step 1 following the Generative Design Framework.
- Design Decision 1-Prefabrication Strategy for Construction Planning
- Design Variables
- Prefab percentage
- Number of cranes
- Trucks per day
- Work hours per day
- Evaluators
- Construction duration
- Construction cost
- Waste generated
- Safety risk
- Most Important Tradeoffs to Consider
- Higher prefabrication can reduce construction duration and waste, but it can increase cost due to fabrication, transportation, and coordination.
- More cranes and more trucks can speed up construction, but they increase cost and site safety risk.
- Longer work hours can reduce project duration, but they can increase labor cost and safety concerns.
- Design Decision 2-Construction Crew Planning
- Design Variables
- Number of crews
- Crew size
- Number of parallel work zones
- Work hours per day
- Evaluators
- Project duration
- Labor cost
- Productivity
- Site congestion
- Most Important Tradeoffs to Consider
- More crews and parallel work zones can reduce construction duration, but they increase labor cost and coordination complexity.
- Larger crews may improve productivity, but they can also create congestion if too many workers are active in the same area.
- Design Decision 3-Facade Design Strategy
- Design Variables
- Window-to-wall ratio
- Shading depth
- Panel size
- Material type
- Evaluators
- Daylight access
- Solar heat gain
- Facade cost
- Embodied carbon
- Most Important Tradeoffs to Consider
- A higher window-to-wall ratio can improve daylight and views, but it can increase solar heat gain and cooling demand.
- Deeper shading can reduce heat gain, but it may reduce daylight access and increase facade complexity.
- Higher-performance materials may improve energy performance, but they can increase cost and embodied carbon.
Step 2 - Generative Design Study
For my Generative Design study, I selected Design Decision 1: Prefabrication Strategy for Construction Planning.
The objective of this study was to explore how different construction planning choices affect the tradeoff between construction duration, construction cost, waste generated, and safety risk. I created a simple Dynamo study graph using four inputs and four outputs. The model was intentionally kept lightweight, using simple formulas instead of a detailed construction simulation.
The objective was to identify a balanced construction strategy that can reduce project duration and waste without creating excessive cost or safety risk.
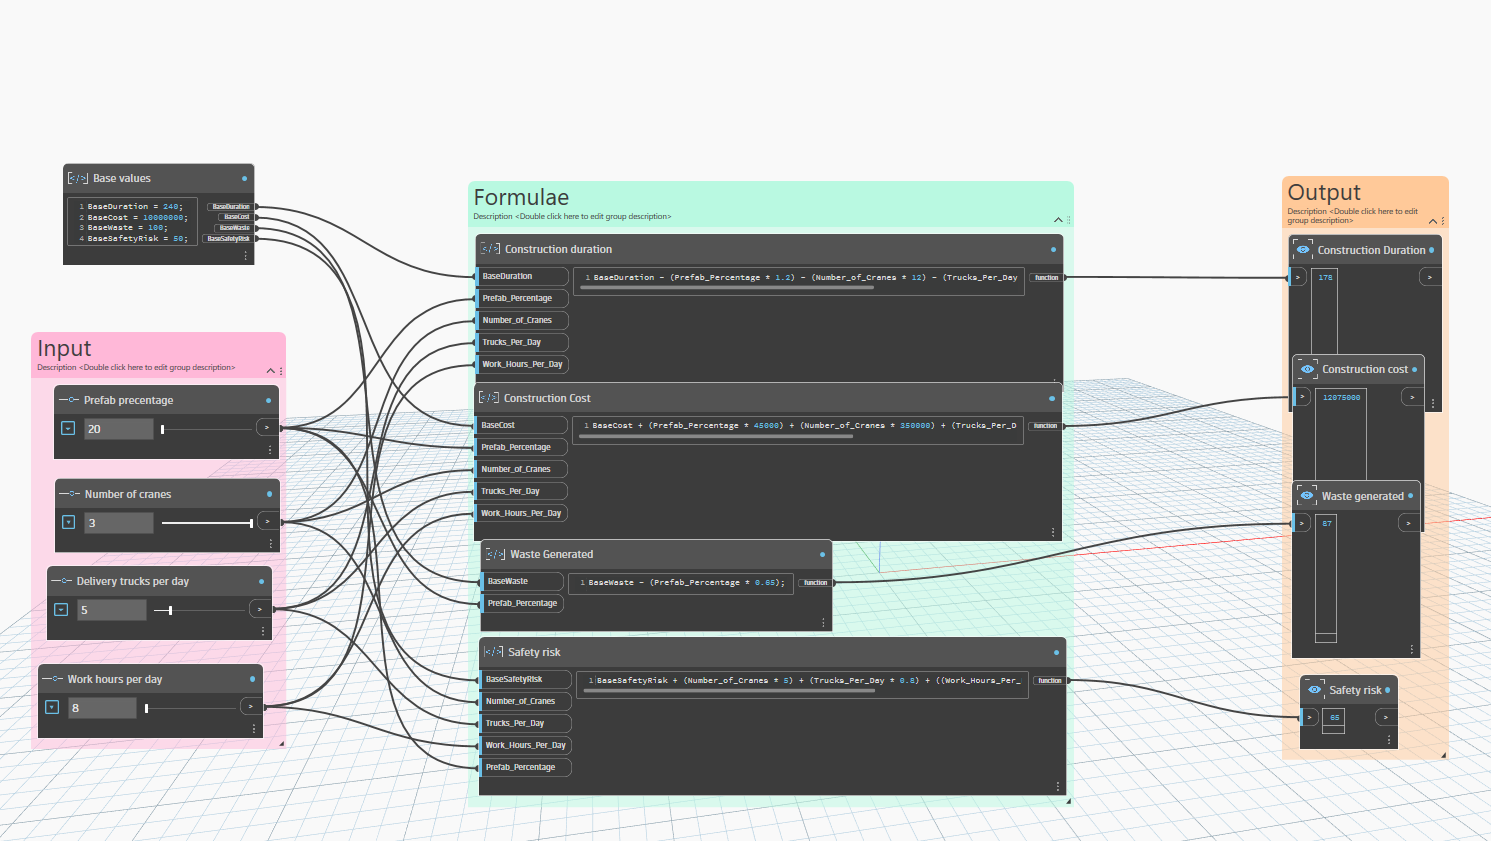
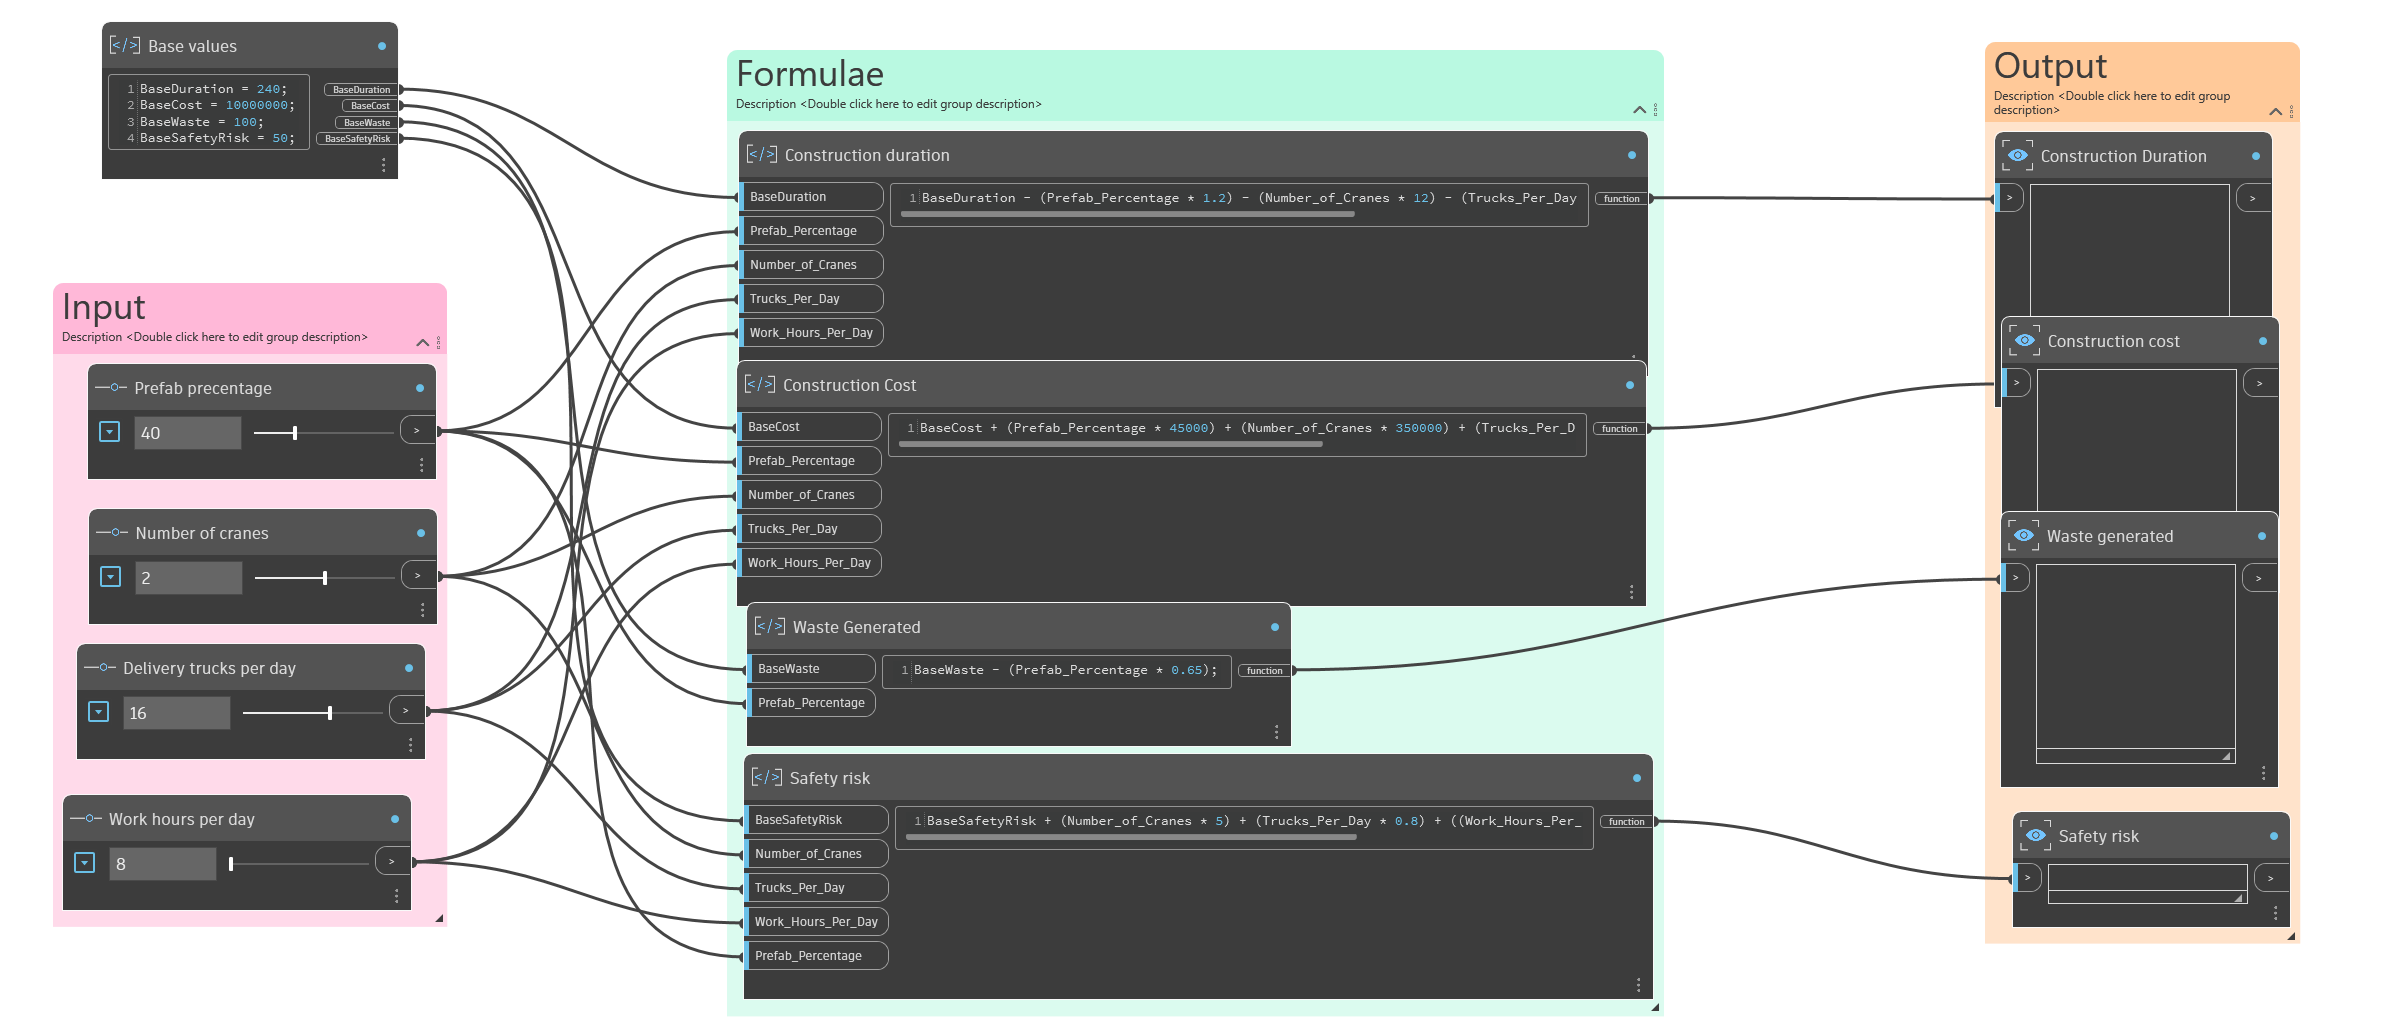
Model
The model uses four input variables related to prefabrication and construction logistics. These inputs are connected to simple formula blocks in Dynamo. The formulas calculate four output evaluators that help compare the performance of each generated option.
The model does not represent an exact real-world estimate. Instead, it is a simplified decision-support model that shows the direction of the tradeoffs between different construction planning strategies.
Design Variables /Inputs
- Prefab Percentage- This represents the percentage of the project delivered using prefabricated components.
- Number of Cranes- This represents the amount of major lifting equipment available on site.
- Trucks per Day - This represents the daily delivery capacity for prefab components and materials.
- Work Hours per Day- This represents the length of the daily construction work window.
Constants / Base Values (Assumptions)
- Base Duration: 240 days
- Base Cost: $10,000,000
- Base Waste: 100 tons
- Base Safety Risk: 50
These values were used as starting assumptions to compare different generated options consistently. They are not intended to be final project estimates. The goal was to create a simple model that could show relative performance between alternatives.
Evaluators / Study Outputs
- Construction Duration This output estimates the total project duration in days. It was minimized in the study because shorter construction duration is generally desirable.
- Construction Cost This output estimates the total cost of the construction strategy. It was minimized because lower cost is desirable, but the model assumes that faster strategies usually require more resources and therefore cost more.
- Waste Generated This output estimates the amount of construction waste generated. It was minimized because lower waste supports sustainability goals. Higher prefabrication is assumed to reduce waste.
- Safety Risk This output is a simplified safety risk score. It was minimized because lower risk is desirable. The model assumes that more cranes, more trucks, and longer work hours increase safety risk, while higher prefabrication slightly reduces onsite risk.
Formula Assumptions
The formulas were based on simple construction logic:
- For construction duration, I assumed:
- Each 1% increase in prefabrication reduces duration by 1.2 days.
- Each crane reduces duration by 12 days.
- Each additional truck per day reduces duration by 0.4 days.
- Each extra work hour beyond 8 hours reduces duration by 8 days.
- These values show that prefabrication and longer work hours have stronger schedule impact than truck deliveries.
- For construction cost, I assumed:
- Each 1% increase in prefabrication adds $45,000.
- Each crane adds $350,000.
- Each truck per day adds $25,000.
- Each extra work hour beyond 8 hours adds $200,000.
- These values represent added fabrication, equipment, transportation, labor, and coordination costs.
- For waste generated, I assumed:
- Each 1% increase in prefabrication reduces waste by 0.65 tons.
- Prefabrication reduces waste because more work happens in controlled factory conditions.
- For safety risk, I assumed:
- Each crane adds 5 risk points.
- Each truck per day adds 0.8 risk points.
- Each extra work hour beyond 8 hours adds 4 risk points.
- Each 1% increase in prefabrication reduces safety risk by 0.2 points.
- More site activity increases risk, while prefabrication reduces some onsite work.
The formulas are simplified and mostly linear. This was intentional because the assignment asked for a simple study graph that could clearly show tradeoffs without becoming too complex.
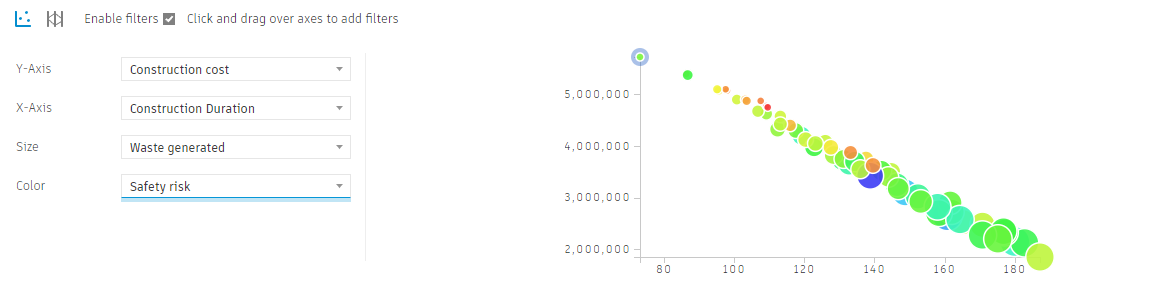
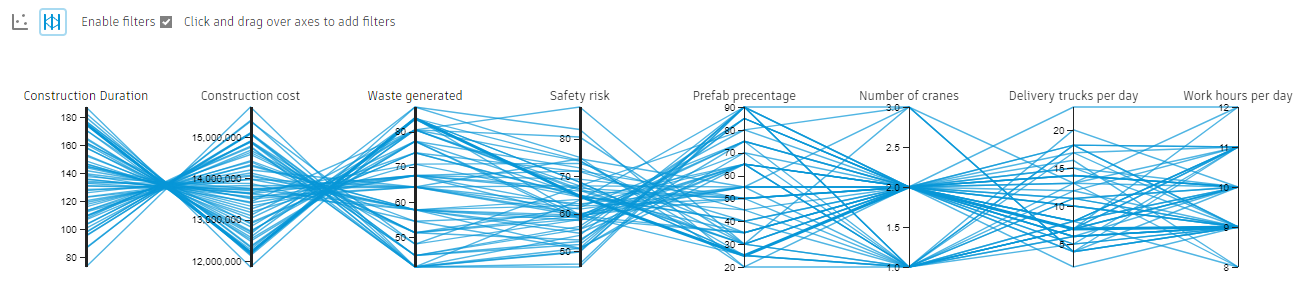
Step 3 - Generative Design Study Results
- The scatterplot shows the results of the Generative Design study. Each point represents one generated construction planning option.

In my scatterplot:
- X-axis: Construction Duration
- Y-axis: Construction Cost
- Bubble size: Waste Generated
- Color: Safety Risk
The graph shows a clear tradeoff between construction duration and construction cost. Options with shorter duration generally have higher cost because they require more prefabrication, more cranes, more trucks, or longer work hours. Options with lower cost generally take longer because they use fewer resources.
The bubble size represents waste generated. Smaller bubbles generally indicate options with higher prefabrication because prefabrication reduces onsite waste. The color represents safety risk. Options with more cranes, more trucks, and longer work hours tend to have higher safety risk.
The main insight from the graph is that there is no single perfect option. The fastest options are not automatically the best because they are more expensive and may have higher safety risk. The lowest-cost options are also not ideal because they take longer. The most useful options are the balanced alternatives in the middle of the scatterplot, where duration is reduced without creating excessive cost, waste, or safety risk.
I would use this information to support a construction planning decision by selecting a balanced strategy rather than simply choosing the fastest or cheapest option. For example, I would look for an option with moderate-to-high prefabrication, enough cranes and trucks to support efficient installation, and reasonable work hours that do not create unnecessary safety concerns.
