BIMtopia
/CEE 120C/220C Parametric Design & Optimization | Spring 2025
CEE 120C/220C Parametric Design & Optimization | Spring 2025
/
❗
Assignment: Evaluate Your Alternatives
❗

Assignment: Evaluate Your Alternatives

Overview

In this assignment, you’ll build upon your work for the Module 5 Assignment -- recommending a proposed design to the developers of the new high-rise building project in Dubai based on your evaluation of potential building forms.

image
‣

Design Brief Recap

This project will be located in Dubai, near the Burj Khalifa in a rapidly-growing area near the Business Bay.

The project site is the open rectangular plot near the bottom of this image (to the northeast of the bay).

image

Your design task is to create alternative building forms that we’ll be able to evaluate as the developer considers options for the final design. The developer’s design goals include:

Building Geometry

  • Provide between 2,500,000 and 3,000,000 SF of new floor area.
  • Stay within the site development limits:
    • Up to 300m (984 feet) wide x 100 meters (328 feet) deep in plan view
    • No taller than the site’s height limitation of 230 meters (755 feet).

Building Performance

  • Minimize the surface area of the building envelope.
  • Maximize the solar insolation potential as measured by cumulative insolation available on the building envelope surfaces throughout the year.

Economics

  • Minimize the projected construction cost – for simplicity, assume that the construction cost per square foot will grow linearly from USD $500 per square foot at ground level to USD $1000 per square foot at 750’ above the ground.
‣

Our Approach - Creating Additional Metrics to Evaluate the Building Form Alternatives

In the Module 5 assignment, you:

  • created parametrically-driven building forms that can be easily changed by varying one or two parameters
  • set up the node logic in Dynamo or Grasshopper to vary those parameters and flex the forms
  • reported some simple metrics that were automatically computed by Revit or Grasshopper for every variation of the building form:
    • the gross floor area created
    • the gross surface area of the building envelope
    • the gross volume of the tower

In this assignment, you’ll build upon and extend that work -- creating node logic to compute additional evaluation metrics.

‣

What Makes a Building Form “Better” and How Can We Measure It?

The examples in Module 6 illustrate workflows to compute evaluation metrics based on:

  • Measures of the key properties that are determined by the geometry of the building form
    • For example, estimated construction cost or expected real estate value estimated based on the types and location of the floor area constructed.
    • image
  • Measures of how the building surfaces relate to other things
    • For example, directness of wall surfaces or panels to the sun or other objects of interest (such as a landmark or water view).
    • Example: black dots represent a viewpoint
      Example: black dots represent a viewpoint
  • Measures of expected building performance based on simulations with analysis tools
    • For example, solar insolation potential based on a simulation performed using analysis tools.
    • Daylight Potential Analysis Example in Forma
      Daylight Potential Analysis Example in Forma
‣

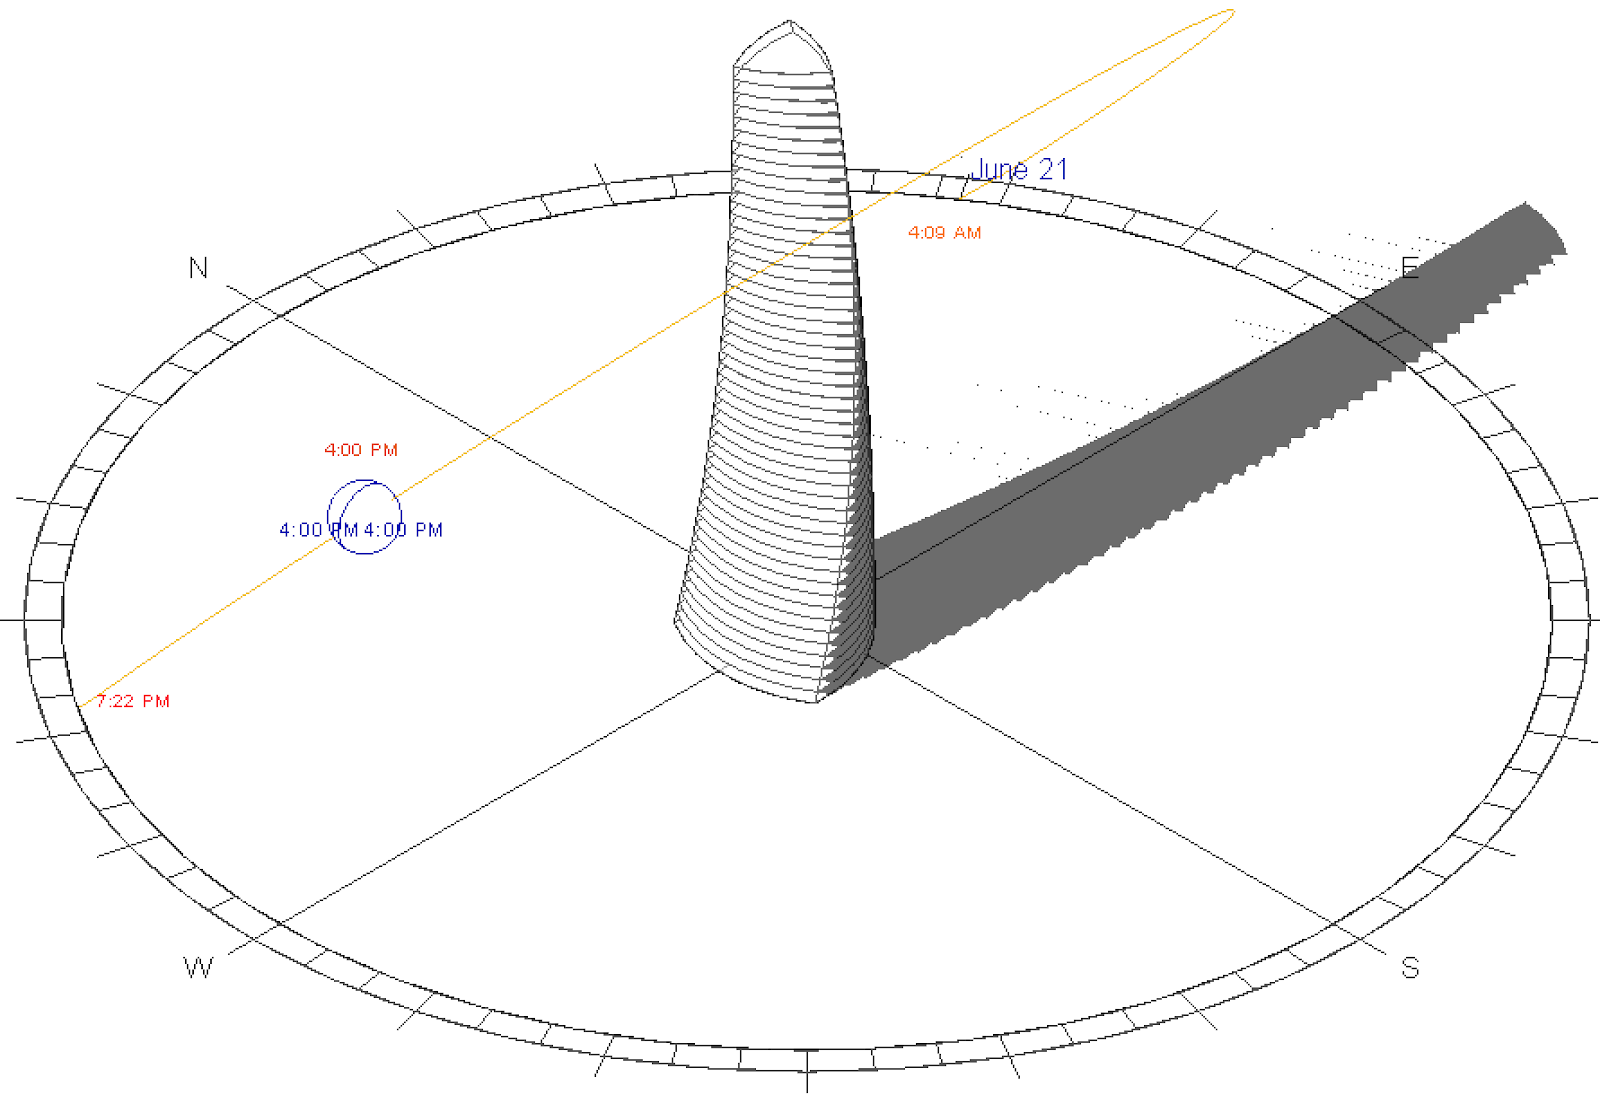
Solar Analysis Use For Any Portion Update

If you are going to use the solar analysis nodes to calculate metric value outputs, install the following version as it is essential for the Solar Analysis examples to work properly. You can find additional details in Module 6 Section 6.2 Workflows on Canvas.

Dynamo - Solar Analysis

image

Ladybug - Weather & Environmental Analysis

image
image

Honeybee - Daylight & Energy Simulation

image
image

Butterfly - CFD

image
image
image
image

Steps to Complete

‣

Stage 1: Create Two New Evaluator Custom Nodes (for 2 or more units)

Create two new custom nodes to measure and report evaluation metrics for your building form test cases created in Module 5.

Step 1 – Design Two New Metrics for Evaluating Building Forms

  • Start by thinking about what features or metrics are most important to measure for evaluating the building form alternatives.
    • If you were recommending a potential alternative to the developer, what metrics would be most useful to cite to help make your case? What criteria would you use for choosing one alternative as being better than another.
      • Test your new evaluation logic to confirm that it returns valid values for one test case (a single set of input values).
    • Choose the two metrics that you feel would be most important to consider.
    • You can use the custom nodes provided in the examples as a starting point or as inspiration for your new evaluation metrics.
    • 💡
      If you one of the example nodes as the basis for your new evaluation metric, be sure to adapt it or customize it to incorporate a new analysis or approach that demonstrates your own unique perspective. We’re looking for something new!
‣

Step 2 - Create Node Logic to Compute These Evaluation Metrics for a Single Instance

  • Implement the node logic to compute each of these two metrics for a single instance of the building form.
    • Make a copy of your testing function (Dynamo custom node or Grasshopper loop) from Module 5 and incorporate the new evaluation logic into it.
‣

Step 3 - Create Custom Nodes that Can Be Used to Evaluate Many Instances

  • Select your new node logic and create two new custom nodes which:
    • accepts an instance of the building form of the input to be evaluated
    • retains the evaluation values computed for each test case
‣

Step 4 - Use Your Custom Nodes to Report New Evaluation Values for Each Test Case

  • Integrate your two new custom nodes into your testing node logic.
  • 💡
    If using a Revit conceptual mass for your building form, be sure to evaluate the updated building forms by placing your evaluation nodes after the Transaction.End node.
  • In your testing node, create a list of showing the input values and the evaluation metrics for each test case. The list should include:
    • These values computed in Module 5:
      • Input parameter value 1
      • Input parameter value 2 (if testing two inputs)
      • Gross Floor Area
      • Gross Surface Area
      • Gross Volume
    • Plus your two new evaluation metrics
      • Your evaluation metric 1
      • Your evaluation metric 2
  • Return this list of input values and evaluations as the output from your testing node.
  • Run the same series of test cases used in Module 5, and report the input values used and the resulting metrics for each case in an easy-to-read summary table (created in Word, Excel, Google Sheets, or any data table tool) showing the input values tested and the values computed for each of the reported metrics.
💡
Point to Ponder: Do the new evaluation metrics that you’ve designed capture the meaningful differences between the building form alternatives? What other metrics would be useful to compute to help understand and make the case for which alternatives are truly better than others?
‣

Stage 2: Develop a Single-Objective Optimization Scheme (for 3 or more units)

How could you combine all of metrics computed for each test case into a single metric for recommending the “best case” alternatives to your client? Can you come with a single-objective that captures all the design goals and optimize that one value?

This isn’t an easy task! It’s very difficult to come up with a single evaluation that captures all the nuances of what makes one alternative better than another — especially when you consider tradeoffs. Yet, many times, decisions are made based ranking alternatives based on a single combined evaluation.

Don’t be intimidated by anxiety you’re feeling as you try to come up with a single combined evaluation that actually captures all the complexity in comparing the options. That’s a real world scenario. Any scheme that reduces a complex decision with competing factors that pull in different directions will have significant flaws or known weaknesses.

So, our point in this stage is to understand the limitations of a single-objective optimization approach:

  • For Module 6, embrace those limitations and come up with your best recommendation about how to create a single combined evaluation.
  • In Module 7, we’ll explore another approach — multi-objective optimization — that will give us better tools for visualizing the tradeoffs and making more informed decisions.
‣

Step 1 – Design a Single-Objective Optimization Scheme for Using the Computed Evaluators to Compare and Rank the Building Form Alternatives

Develop a scheme, strategy, rationale, or approach -- whatever you’d like to call it -- for how to use the evaluation metrics that you’ve computed to recommend what you consider to be “best cases” alternatives to your client. As you develop your scheme, consider:

  • How do the metrics interact?
    • Which metrics are aligned (move in the same direction) as the input values are varied?
    • And which metrics are tradeoffs (move in divergent directions)?
  • What metrics are most important to consider for the decision or recommendation being made?
    • How would you weight or scale the values returned by your evaluation metrics to reflect their relative importance?
  • Can you create a new single measure that mathematically combines the individual metrics in a sensible way?
💡
Point to Ponder: What overall strategy do you feel best captures the relationship between the evaluation metrics? Clearly articulating your design strategy is the key aspect of this task.  Before you dive into implementing your scheme, briefly describe your thinking and strategy in a paragraph that outlines your thinking and approach.
‣

Step 2 – Implement Your Single-Objective Optimization Scheme

  • Implement your Single-Object Optimization scheme using node logic in Dynamo, Grasshopper, or using a spreadsheet (for example, Microsoft Excel or Google Sheets).
  • Report the results of each of the building form test cases including the input parameter values and all the computed evaluation metrics in an easy-to-read table.
  • Highlight your top 3 recommended design alternatives (for either one the example building forms or the new building form that you designed) and recommend the one design that you consider to be the “best”.
💡
Point to Ponder: What propelled the recommended alternative to the top of the list? Explain your reasoning -- include a brief analysis of why this alternative rose to the top of the list and why you consider it to be the best option. Are there important nuances or tradeoffs that got lost is the single evaluation?
‣

Stage 3: Visualize the Recommended Alternative (for 4 units only)

Create a simple Revit, Rhino, or Autodesk Forma model to visualize your recommended design alternative.

Choose one of these options:

‣

Option 1 Create a Simple Revit or Rhino Model Illustrating the Recommended Building Form

  • Use the input parameter values for “best” case to create a building form in Revit or Grasshopper that illustrates the recommended design.
  • Panelize that recommended form by dividing the wall surfaces into UV grids and applying a simple adaptive panel component:
    • If modeling in Dynamo and Revit, use the Rect_Panel with Resizable Opening adaptive panel.
    • If modeling in Grasshopper, use one of the LunchBox Panel nodes.
  • Provide visual feedback by adjusting the color, opening size, or some other parameter of your adaptive panels to reflect one of the evaluations computed for the panels.
    • Compute values to adjust the appearance of the panels.
      • If you’ve created an evaluation metric based on panel geometry (for example, directness to the sun or an object of interest), use that custom node to generate values for each of your adaptive panels.
      • 💡
        See Step 6B in this example for a suggested workflow).
        Example: Visualizing a Selected Alternative using Dynamo

        Mindmap

        bimtopia.com

      • If not, use the Panels.ComputeSunDirectnessOutwardNormals custom node to generate values for each panel.
    • Use these values to adjust the appearances of the panels applied to your recommended building form.
‣

Option 2 Visualize the Recommended Building Form in Autodesk Forma

💡
To follow this workflow, you’ll need to use your custom node for generating a building form with Dynamo from the Module 5 assignment: Stage 2 - Step 1.
‣

Step 1 - Create a Dynamo Graph to Generate Your Building Form

  • Create a new Dynamo graph that uses you building form generator custom node.
    • Insert your custom node that generates the building form for a set on input values or copy the node logic directly into this new Dynamo graph.
  • Add number sliders to set the input values to your custom node.
    • Right-click on each of these input slider nodes and turn on the Is Input checkmark.
  • Use the SendToForma node from the DynamoFormaBeta package to send your recommended building form to Autodesk Forma.
    • Right-click on the SendToForm node and turn on the Is Output checkmark.
  • Save this Dynamo graph to a folder location that you’ll use in Step 2.
‣

Step 2 - Use Dynamo Player in Autodesk Forma to Place Your Building Form on the Project Site

‣
Step 2A - Enable Autodesk Forma for Your Autodesk ID
💡
YOU MUST COMPLETE THESE STEP TO ENABLE AUTODESK FORMA FOR YOUR AUTODESK ID.
  • Go to http://students.autodesk.com, and sign into your Autodesk account.
  • Student and Education Software | 1-Year License | Autodesk Education Community

    Unlock your creative potential with access to 3D design software from Autodesk. Software downloads are available to students, educators, educational institutions.

    www.autodesk.com

    Student and Education Software | 1-Year License | Autodesk Education Community
  • Go to Products and scroll down to the Autodesk Forma tile.
  • image
    image
💡
This will redirect you to the Autodesk Forma site — where you should be able to select the Stanford CEE Student hub.

image
💡
If you are prompted to “create a hub”, choose SKIP to return to the list of hubs that you have been invited to. Then, select the Stanford CEE Student hub.
‣
Step 2B - Open the Autodesk Forma project
  • Open the Autodesk Forma web application.
  • app.autodeskforma.com

    app.autodeskforma.com

  • Open the Stanford CEE Student Hub
    • Click the Projects link from the left navigation bar in the Forma web interface, then open the CEE 120C/220C folder in the All projects section of the page.
  • Open the Dubai - Burj Khalifa Area project.
‣
Step 2C - Create a new Proposal for your version of the building form
  • Open the Navigator panel in the left toolbar.
  • Right-click on the Template-Duplicate Me proposal, then choose Duplicate from the submenu to create your own proposal for visualizing your tower.
image
‣
Step 2D - Use Dynamo Player to generate your building form
‣
Open Dynamo Player
  • Click on the Extensions panel in the left toolbar.
  • Select the Dynamo Player extension.
image
‣
Load Your Dynamo Graph (from Step 1)
  • Enter the Graph folder path (from Step 1) in the Dynamo Player window.
  • Click the Load button.
  • Select your Dynamo graph in the list of graphs presented.
image
‣
Run Dynamo Player
  • Select the desired input values for your building form in the Dynamo Player window.
  • Then, click the Run button to generate the building form.
image
‣
Add Your Building Form to the Project
  • After the Dynamo Player script completes it’s run (and generates the building form), click the Add button to add the build form to the Forma project.
image
‣
Move your Building Form to the Project Site
  • Shrink the Dynamo Player window.
    • Select the building form in Forma window, then use the Move tool to move the building form to the project site.
    • image
image
‣

Step 3 - Use Forma’s Analysis Tools to Visualize Key Metrics

  • Use the tools in the Autodesk Forma analysis palette to visualize key metrics for your proposed building form.
  • Create visualizations for these analyses:
    • Daylight Potential
    • Wind - use the default Rapid analysis.
    • 💡
      Do NOT run the detail analysis (which could take several hours).
    • Solar Energy

Submit

  • Please create a folder named “Module 6” within your personal folder in our Autodesk Construction Cloud project.
  • Create a folder for each stage of the assignment that you’ve completed that includes:
    • Your Revit project (.RVT) file and Dynamo graph (.DYN) file for each stage of the assignment.
    • Or, your Grasshopper (.GH) file for each stage of the assignment.
    • Your new conceptual mass family.
    • The summary tables (created in Word, Excel, Google Sheets, or any data table tool) showing the input values tested and the values computed for each of the reported parameters.
    • 💡
      Be sure to include your new custom nodes and any custom nodes (from the examples) that your graph depends on.
  • Then, copy all of the files in this folder to your Module 6 folder on Autodesk Construction Cloud using the ACC web interface.
  • 💡
    Please the following naming convention for your uploaded files: "#ofUnits_NameAndLastName_Module#_Stage#".  For example: 4units_SampleStudent_Module6_Stage1.rvt
  • Create a link to your Module 6 folder:
    • Right-click on the Module 6 folder in the file tree (at the left side of the interface) and choose Share from the pull-down menu.
    • Choose Share with Project Members, then switch to the Link tab.
    • Click the Copy button to copy the link to your clipboard.
  • Create a new posting on this Notion page — Design Journal Entry: Evaluate Your Alternatives — including:
    • For 2 or More Units: Create Two New Evaluator Nodes
      • Images showing the node logic in your new evaluator nodes
      • An Image/screenshot of your summary table (created in Word, Excel, Google Sheets, or any data table tool) showing the input values tested and the values computed for each of the reported parameters
    • For 3 or More Units: Develop a Single-Objective Optimization Scheme
      • Brief descriptions outlining:
        • Your Single-Objective Optimization scheme (combination/comparison/ranking approach)
        • An Image/screenshot of your summary table (created in Word, Excel, Google Sheets, or any data table tool) showing the input values tested and the values computed for each of the reported parameters.
          • Be sure to highlight your top 3 recommended design alternatives (for either one the example building forms or the new building form that you designed) and recommend the one design that you consider to be the “best”.
        • An explanation of why you consider the recommended building form to be the “best” choice
    • For 4 Units: Visualize the Recommended Alternative
      • Images/screenshots showing the recommended building form based on your evaluation and analysis.
        • If created in Revit or Grasshopper, show the panelized building form with visual feedback showing how your panels reflect one of the evaluations computed for the panels.
        • If created in Autodesk Forma, share images/screenshots showing the results of the Daylight, Wind, and Solar Energy analysis.
    • Your answers to the Points to Ponder questions for each stage of the assignment that you completed.
    • The link to your Module 6 folder in our Autodesk Construction Cloud project.